Paraburkholderia caffeinilytica
Taxonomy: cellular organisms; Bacteria; Proteobacteria; Betaproteobacteria; Burkholderiales; Burkholderiaceae; Paraburkholderia
Average proteome isoelectric point is 6.62
Get precalculated fractions of proteins
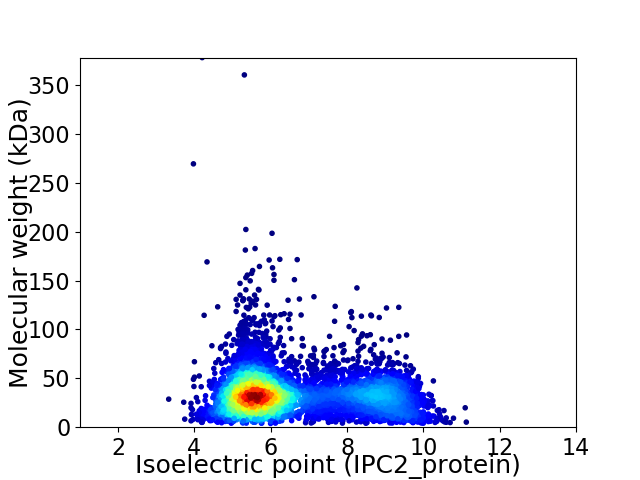
Virtual 2D-PAGE plot for 5423 proteins (isoelectric point calculated using IPC2_protein)
Get csv file with sequences according to given criteria:
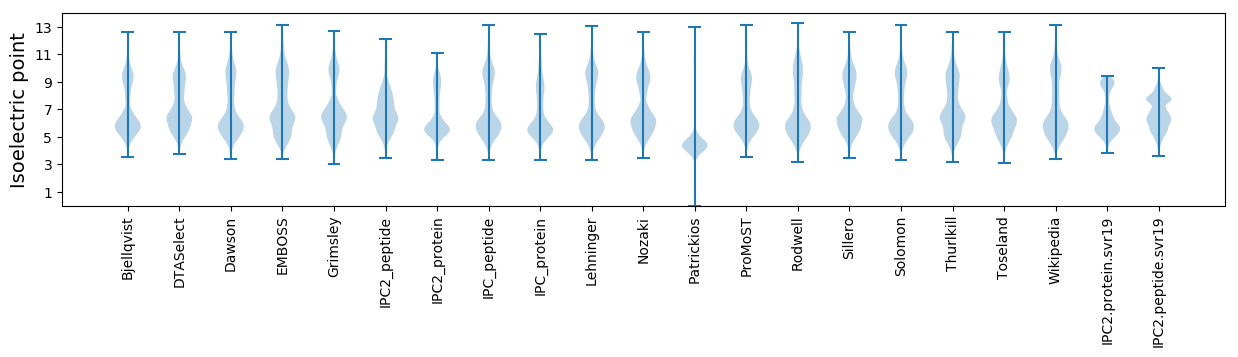
* You can choose from 21 different methods for calculating isoelectric point
Summary statistics related to proteome-wise predictions
Protein with the lowest isoelectric point:
>tr|A0A346BGF7|A0A346BGF7_9BURK ATP synthase gamma chain OS=Paraburkholderia caffeinilytica OX=1761016 GN=atpG PE=3 SV=1
MM1 pKa = 6.7EE2 pKa = 4.1QFYY5 pKa = 10.98EE6 pKa = 4.58GMAEE10 pKa = 3.63IFEE13 pKa = 4.59IDD15 pKa = 3.45VSQITPEE22 pKa = 4.89LDD24 pKa = 3.43LQEE27 pKa = 5.27HH28 pKa = 6.07NWDD31 pKa = 3.51SLAVVSTIALVDD43 pKa = 3.4DD44 pKa = 5.08CFNVMLSGQALNNCNTIADD63 pKa = 4.0IEE65 pKa = 4.31ALISTAKK72 pKa = 10.18KK73 pKa = 10.12AAA75 pKa = 3.64
MM1 pKa = 6.7EE2 pKa = 4.1QFYY5 pKa = 10.98EE6 pKa = 4.58GMAEE10 pKa = 3.63IFEE13 pKa = 4.59IDD15 pKa = 3.45VSQITPEE22 pKa = 4.89LDD24 pKa = 3.43LQEE27 pKa = 5.27HH28 pKa = 6.07NWDD31 pKa = 3.51SLAVVSTIALVDD43 pKa = 3.4DD44 pKa = 5.08CFNVMLSGQALNNCNTIADD63 pKa = 4.0IEE65 pKa = 4.31ALISTAKK72 pKa = 10.18KK73 pKa = 10.12AAA75 pKa = 3.64
Molecular weight: 8.25 kDa
Isoelectric point according different methods:
Protein with the highest isoelectric point:
>tr|A0A346BGV8|A0A346BGV8_9BURK ATP-dependent protease subunit HslV OS=Paraburkholderia caffeinilytica OX=1761016 GN=hslV PE=3 SV=1
MM1 pKa = 7.35KK2 pKa = 9.36RR3 pKa = 11.84TYY5 pKa = 10.06QPSVTRR11 pKa = 11.84RR12 pKa = 11.84KK13 pKa = 8.0RR14 pKa = 11.84THH16 pKa = 5.76GFRR19 pKa = 11.84VRR21 pKa = 11.84MKK23 pKa = 8.74TAGGRR28 pKa = 11.84KK29 pKa = 9.04VINARR34 pKa = 11.84RR35 pKa = 11.84AKK37 pKa = 9.65GRR39 pKa = 11.84KK40 pKa = 8.85RR41 pKa = 11.84LAII44 pKa = 4.0
MM1 pKa = 7.35KK2 pKa = 9.36RR3 pKa = 11.84TYY5 pKa = 10.06QPSVTRR11 pKa = 11.84RR12 pKa = 11.84KK13 pKa = 8.0RR14 pKa = 11.84THH16 pKa = 5.76GFRR19 pKa = 11.84VRR21 pKa = 11.84MKK23 pKa = 8.74TAGGRR28 pKa = 11.84KK29 pKa = 9.04VINARR34 pKa = 11.84RR35 pKa = 11.84AKK37 pKa = 9.65GRR39 pKa = 11.84KK40 pKa = 8.85RR41 pKa = 11.84LAII44 pKa = 4.0
Molecular weight: 5.2 kDa
Isoelectric point according different methods:
Peptides (in silico digests for buttom-up proteomics)
Below you can find in silico digests of the whole proteome with Trypsin, Chymotrypsin, Trypsin+LysC, LysN, ArgC proteases suitable for different mass spec machines.| Try ESI |
 |
|---|
| ChTry ESI |
|
|---|
| ArgC ESI |
|
|---|
| LysN ESI |
|
|---|
| TryLysC ESI |
|
|---|
| Try MALDI |
|
|---|
| ChTry MALDI |
|
|---|
| ArgC MALDI |
|
|---|
| LysN MALDI |
|
|---|
| TryLysC MALDI |
|
|---|
| Try LTQ |
|
|---|
| ChTry LTQ |
|
|---|
| ArgC LTQ |
|
|---|
| LysN LTQ |
|
|---|
| TryLysC LTQ |
|
|---|
| Try MSlow |
|
|---|
| ChTry MSlow |
|
|---|
| ArgC MSlow |
|
|---|
| LysN MSlow |
|
|---|
| TryLysC MSlow |
|
|---|
| Try MShigh |
|
|---|
| ChTry MShigh |
|
|---|
| ArgC MShigh |
|
|---|
| LysN MShigh |
|
|---|
| TryLysC MShigh |
|
|---|
General Statistics
Number of major isoforms |
Number of additional isoforms |
Number of all proteins |
Number of amino acids |
Min. Seq. Length |
Max. Seq. Length |
Avg. Seq. Length |
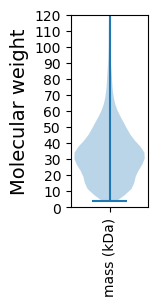
Avg. Mol. Weight |
|---|---|---|---|---|---|---|---|
0 |
1771409 |
37 |
3896 |
326.6 |
35.41 |
Amino acid frequency
Ala |
Cys |
Asp |
Glu |
Phe |
Gly |
His |
Ile |
Lys |
Leu |
|---|---|---|---|---|---|---|---|---|---|
12.7 ± 0.043 | 0.896 ± 0.01 |
5.373 ± 0.025 | 5.138 ± 0.034 |
3.744 ± 0.024 | 8.218 ± 0.035 |
2.299 ± 0.016 | 4.79 ± 0.024 |
3.131 ± 0.028 | 10.195 ± 0.037 |
Met |
Asn |
Gln |
Pro |
Arg |
Ser |
Thr |
Val |
Trp |
Tyr |
|---|---|---|---|---|---|---|---|---|---|
2.368 ± 0.017 | 2.908 ± 0.024 |
5.008 ± 0.022 | 3.649 ± 0.02 |
6.683 ± 0.035 | 5.789 ± 0.027 |
5.544 ± 0.033 | 7.776 ± 0.025 |
1.347 ± 0.015 | 2.445 ± 0.017 |
Most of the basic statistics you can see at this page can be downloaded from this CSV file
See this proteome in:

Proteome-pI is available under Creative Commons Attribution-NoDerivs license, for more details see here
| Reference: Kozlowski LP. Proteome-pI 2.0: Proteome Isoelectric Point Database Update. Nucleic Acids Res. 2021, doi: 10.1093/nar/gkab944 | Contact: Lukasz P. Kozlowski |