Oceanobacillus bengalensis
Taxonomy: cellular organisms; Bacteria; Terrabacteria group; Firmicutes; Bacilli; Bacillales; Bacillaceae; Oceanobacillus
Average proteome isoelectric point is 6.15
Get precalculated fractions of proteins
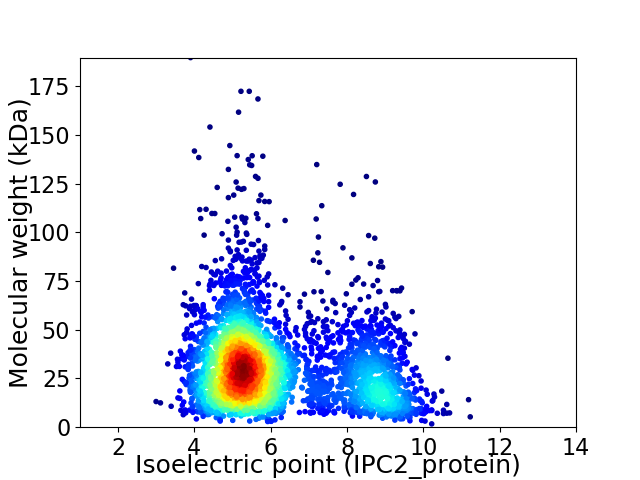
Virtual 2D-PAGE plot for 3792 proteins (isoelectric point calculated using IPC2_protein)
Get csv file with sequences according to given criteria:
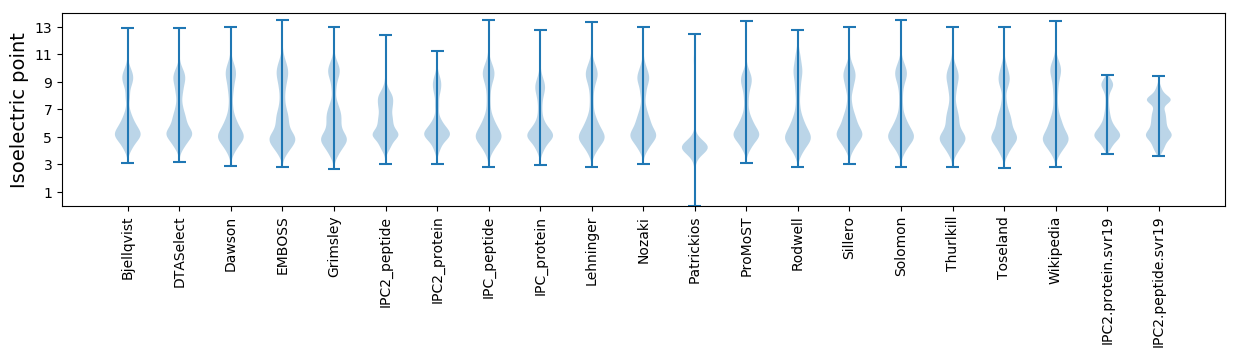
* You can choose from 21 different methods for calculating isoelectric point
Summary statistics related to proteome-wise predictions
Protein with the lowest isoelectric point:
>tr|A0A494YR42|A0A494YR42_9BACI Uncharacterized protein OS=Oceanobacillus bengalensis OX=1435466 GN=D8M05_19845 PE=4 SV=1
MM1 pKa = 7.57KK2 pKa = 10.32KK3 pKa = 10.06LLAFISILFVCFLAACGGNNDD24 pKa = 4.02AEE26 pKa = 4.41NGEE29 pKa = 4.2EE30 pKa = 3.9ASTIKK35 pKa = 10.69VGASSVPHH43 pKa = 7.4AEE45 pKa = 3.98ILEE48 pKa = 4.26EE49 pKa = 4.18AVPLLEE55 pKa = 5.68DD56 pKa = 3.35EE57 pKa = 5.68GITLEE62 pKa = 3.94IEE64 pKa = 4.2PYY66 pKa = 10.24EE67 pKa = 5.23DD68 pKa = 3.47YY69 pKa = 11.39VLPNDD74 pKa = 4.67DD75 pKa = 4.86LASGDD80 pKa = 3.52LDD82 pKa = 4.64ANFFQHH88 pKa = 6.8VPFLNQTIADD98 pKa = 3.64TGYY101 pKa = 8.93EE102 pKa = 3.87IEE104 pKa = 4.92SIGEE108 pKa = 3.63IHH110 pKa = 6.82IEE112 pKa = 3.82PMGVYY117 pKa = 9.31SQNIKK122 pKa = 10.46SVEE125 pKa = 4.12EE126 pKa = 3.79IAEE129 pKa = 4.15GTEE132 pKa = 4.34VILSNSIAEE141 pKa = 4.25HH142 pKa = 5.78GRR144 pKa = 11.84ILSLFEE150 pKa = 3.91QQGLLTLDD158 pKa = 3.52EE159 pKa = 4.56SVEE162 pKa = 4.07KK163 pKa = 10.76SAATIDD169 pKa = 5.15DD170 pKa = 3.35IVEE173 pKa = 4.07NPKK176 pKa = 10.62NLTFSHH182 pKa = 7.16DD183 pKa = 3.7FAPEE187 pKa = 3.91FLPEE191 pKa = 4.7LYY193 pKa = 10.31HH194 pKa = 8.31SEE196 pKa = 4.06EE197 pKa = 4.02EE198 pKa = 4.05ALVVINTNYY207 pKa = 10.86AIGAEE212 pKa = 4.22LNPLEE217 pKa = 4.25DD218 pKa = 4.82AIFIEE223 pKa = 4.78EE224 pKa = 4.48EE225 pKa = 3.48EE226 pKa = 4.24SEE228 pKa = 4.94YY229 pKa = 11.32YY230 pKa = 10.58NVIAVQSEE238 pKa = 4.28DD239 pKa = 3.57VNNEE243 pKa = 3.81ALHH246 pKa = 6.26KK247 pKa = 10.17LVEE250 pKa = 4.19VLISEE255 pKa = 5.41DD256 pKa = 3.08IQNFILEE263 pKa = 4.39NYY265 pKa = 8.3EE266 pKa = 3.84GAVIPVGGNSS276 pKa = 3.05
MM1 pKa = 7.57KK2 pKa = 10.32KK3 pKa = 10.06LLAFISILFVCFLAACGGNNDD24 pKa = 4.02AEE26 pKa = 4.41NGEE29 pKa = 4.2EE30 pKa = 3.9ASTIKK35 pKa = 10.69VGASSVPHH43 pKa = 7.4AEE45 pKa = 3.98ILEE48 pKa = 4.26EE49 pKa = 4.18AVPLLEE55 pKa = 5.68DD56 pKa = 3.35EE57 pKa = 5.68GITLEE62 pKa = 3.94IEE64 pKa = 4.2PYY66 pKa = 10.24EE67 pKa = 5.23DD68 pKa = 3.47YY69 pKa = 11.39VLPNDD74 pKa = 4.67DD75 pKa = 4.86LASGDD80 pKa = 3.52LDD82 pKa = 4.64ANFFQHH88 pKa = 6.8VPFLNQTIADD98 pKa = 3.64TGYY101 pKa = 8.93EE102 pKa = 3.87IEE104 pKa = 4.92SIGEE108 pKa = 3.63IHH110 pKa = 6.82IEE112 pKa = 3.82PMGVYY117 pKa = 9.31SQNIKK122 pKa = 10.46SVEE125 pKa = 4.12EE126 pKa = 3.79IAEE129 pKa = 4.15GTEE132 pKa = 4.34VILSNSIAEE141 pKa = 4.25HH142 pKa = 5.78GRR144 pKa = 11.84ILSLFEE150 pKa = 3.91QQGLLTLDD158 pKa = 3.52EE159 pKa = 4.56SVEE162 pKa = 4.07KK163 pKa = 10.76SAATIDD169 pKa = 5.15DD170 pKa = 3.35IVEE173 pKa = 4.07NPKK176 pKa = 10.62NLTFSHH182 pKa = 7.16DD183 pKa = 3.7FAPEE187 pKa = 3.91FLPEE191 pKa = 4.7LYY193 pKa = 10.31HH194 pKa = 8.31SEE196 pKa = 4.06EE197 pKa = 4.02EE198 pKa = 4.05ALVVINTNYY207 pKa = 10.86AIGAEE212 pKa = 4.22LNPLEE217 pKa = 4.25DD218 pKa = 4.82AIFIEE223 pKa = 4.78EE224 pKa = 4.48EE225 pKa = 3.48EE226 pKa = 4.24SEE228 pKa = 4.94YY229 pKa = 11.32YY230 pKa = 10.58NVIAVQSEE238 pKa = 4.28DD239 pKa = 3.57VNNEE243 pKa = 3.81ALHH246 pKa = 6.26KK247 pKa = 10.17LVEE250 pKa = 4.19VLISEE255 pKa = 5.41DD256 pKa = 3.08IQNFILEE263 pKa = 4.39NYY265 pKa = 8.3EE266 pKa = 3.84GAVIPVGGNSS276 pKa = 3.05
Molecular weight: 30.34 kDa
Isoelectric point according different methods:
Protein with the highest isoelectric point:
>tr|A0A494YZ20|A0A494YZ20_9BACI OsmC family peroxiredoxin OS=Oceanobacillus bengalensis OX=1435466 GN=D8M05_10545 PE=3 SV=1
MM1 pKa = 7.44KK2 pKa = 9.6RR3 pKa = 11.84TFQPNNRR10 pKa = 11.84KK11 pKa = 9.23RR12 pKa = 11.84KK13 pKa = 8.12KK14 pKa = 8.46VHH16 pKa = 5.5GFRR19 pKa = 11.84TRR21 pKa = 11.84MSTKK25 pKa = 10.06NGRR28 pKa = 11.84KK29 pKa = 8.75VLARR33 pKa = 11.84RR34 pKa = 11.84RR35 pKa = 11.84KK36 pKa = 9.2KK37 pKa = 10.05GRR39 pKa = 11.84KK40 pKa = 8.66VLSAA44 pKa = 4.05
MM1 pKa = 7.44KK2 pKa = 9.6RR3 pKa = 11.84TFQPNNRR10 pKa = 11.84KK11 pKa = 9.23RR12 pKa = 11.84KK13 pKa = 8.12KK14 pKa = 8.46VHH16 pKa = 5.5GFRR19 pKa = 11.84TRR21 pKa = 11.84MSTKK25 pKa = 10.06NGRR28 pKa = 11.84KK29 pKa = 8.75VLARR33 pKa = 11.84RR34 pKa = 11.84RR35 pKa = 11.84KK36 pKa = 9.2KK37 pKa = 10.05GRR39 pKa = 11.84KK40 pKa = 8.66VLSAA44 pKa = 4.05
Molecular weight: 5.31 kDa
Isoelectric point according different methods:
Peptides (in silico digests for buttom-up proteomics)
Below you can find in silico digests of the whole proteome with Trypsin, Chymotrypsin, Trypsin+LysC, LysN, ArgC proteases suitable for different mass spec machines.| Try ESI |
 |
|---|
| ChTry ESI |
|
|---|
| ArgC ESI |
|
|---|
| LysN ESI |
|
|---|
| TryLysC ESI |
|
|---|
| Try MALDI |
|
|---|
| ChTry MALDI |
|
|---|
| ArgC MALDI |
|
|---|
| LysN MALDI |
|
|---|
| TryLysC MALDI |
|
|---|
| Try LTQ |
|
|---|
| ChTry LTQ |
|
|---|
| ArgC LTQ |
|
|---|
| LysN LTQ |
|
|---|
| TryLysC LTQ |
|
|---|
| Try MSlow |
|
|---|
| ChTry MSlow |
|
|---|
| ArgC MSlow |
|
|---|
| LysN MSlow |
|
|---|
| TryLysC MSlow |
|
|---|
| Try MShigh |
|
|---|
| ChTry MShigh |
|
|---|
| ArgC MShigh |
|
|---|
| LysN MShigh |
|
|---|
| TryLysC MShigh |
|
|---|
General Statistics
Number of major isoforms |
Number of additional isoforms |
Number of all proteins |
Number of amino acids |
Min. Seq. Length |
Max. Seq. Length |
Avg. Seq. Length |
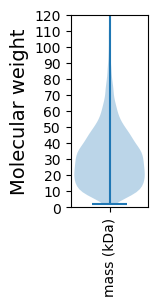
Avg. Mol. Weight |
|---|---|---|---|---|---|---|---|
0 |
1104151 |
14 |
1770 |
291.2 |
32.76 |
Amino acid frequency
Ala |
Cys |
Asp |
Glu |
Phe |
Gly |
His |
Ile |
Lys |
Leu |
|---|---|---|---|---|---|---|---|---|---|
6.662 ± 0.04 | 0.634 ± 0.012 |
5.316 ± 0.029 | 7.81 ± 0.051 |
4.534 ± 0.035 | 6.72 ± 0.033 |
2.032 ± 0.022 | 8.49 ± 0.044 |
6.823 ± 0.04 | 9.539 ± 0.039 |
Met |
Asn |
Gln |
Pro |
Arg |
Ser |
Thr |
Val |
Trp |
Tyr |
|---|---|---|---|---|---|---|---|---|---|
2.798 ± 0.019 | 4.86 ± 0.033 |
3.414 ± 0.024 | 3.492 ± 0.024 |
3.866 ± 0.03 | 5.953 ± 0.03 |
5.516 ± 0.027 | 6.964 ± 0.03 |
0.978 ± 0.014 | 3.598 ± 0.026 |
Most of the basic statistics you can see at this page can be downloaded from this CSV file
See this proteome in:

Proteome-pI is available under Creative Commons Attribution-NoDerivs license, for more details see here
| Reference: Kozlowski LP. Proteome-pI 2.0: Proteome Isoelectric Point Database Update. Nucleic Acids Res. 2021, doi: 10.1093/nar/gkab944 | Contact: Lukasz P. Kozlowski |