Bordetella phage vB_BbrP_BB8
Taxonomy: Viruses; Duplodnaviria; Heunggongvirae; Uroviricota; Caudoviricetes; Caudovirales; Autographiviridae; unclassified Autographiviridae
Average proteome isoelectric point is 6.49
Get precalculated fractions of proteins
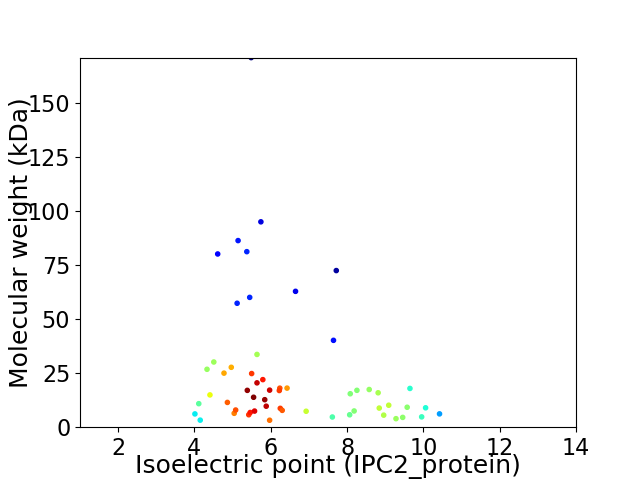
Virtual 2D-PAGE plot for 57 proteins (isoelectric point calculated using IPC2_protein)
Get csv file with sequences according to given criteria:
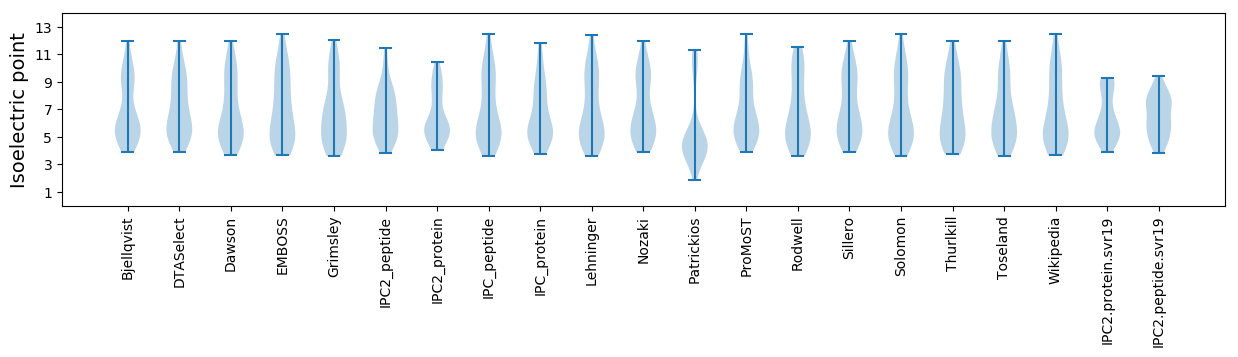
* You can choose from 21 different methods for calculating isoelectric point
Summary statistics related to proteome-wise predictions
Protein with the lowest isoelectric point:
>tr|A0A4Y5TPV3|A0A4Y5TPV3_9CAUD Uncharacterized protein OS=Bordetella phage vB_BbrP_BB8 OX=2587820 GN=bb8_p18 PE=4 SV=1
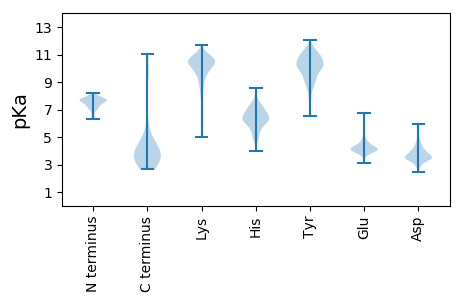
MM1 pKa = 7.89SEE3 pKa = 3.96GSLEE7 pKa = 3.75NSYY10 pKa = 11.33YY11 pKa = 10.96VVLADD16 pKa = 5.58EE17 pKa = 5.42NIQLANSEE25 pKa = 4.19FSVRR29 pKa = 3.79
MM1 pKa = 7.89SEE3 pKa = 3.96GSLEE7 pKa = 3.75NSYY10 pKa = 11.33YY11 pKa = 10.96VVLADD16 pKa = 5.58EE17 pKa = 5.42NIQLANSEE25 pKa = 4.19FSVRR29 pKa = 3.79
Molecular weight: 3.27 kDa
Isoelectric point according different methods:
Protein with the highest isoelectric point:
>tr|A0A4Y5TQY8|A0A4Y5TQY8_9CAUD Uncharacterized protein OS=Bordetella phage vB_BbrP_BB8 OX=2587820 GN=bb8_p25 PE=4 SV=1
MM1 pKa = 7.77RR2 pKa = 11.84SLLRR6 pKa = 11.84RR7 pKa = 11.84VAPEE11 pKa = 3.7SLPTRR16 pKa = 11.84EE17 pKa = 4.64APGATPLNGEE27 pKa = 4.33CWVVTGRR34 pKa = 11.84TKK36 pKa = 11.05
MM1 pKa = 7.77RR2 pKa = 11.84SLLRR6 pKa = 11.84RR7 pKa = 11.84VAPEE11 pKa = 3.7SLPTRR16 pKa = 11.84EE17 pKa = 4.64APGATPLNGEE27 pKa = 4.33CWVVTGRR34 pKa = 11.84TKK36 pKa = 11.05
Molecular weight: 3.95 kDa
Isoelectric point according different methods:
Peptides (in silico digests for buttom-up proteomics)
Below you can find in silico digests of the whole proteome with Trypsin, Chymotrypsin, Trypsin+LysC, LysN, ArgC proteases suitable for different mass spec machines.| Try ESI |
 |
|---|
| ChTry ESI |
|
|---|
| ArgC ESI |
|
|---|
| LysN ESI |
|
|---|
| TryLysC ESI |
|
|---|
| Try MALDI |
|
|---|
| ChTry MALDI |
|
|---|
| ArgC MALDI |
|
|---|
| LysN MALDI |
|
|---|
| TryLysC MALDI |
|
|---|
| Try LTQ |
|
|---|
| ChTry LTQ |
|
|---|
| ArgC LTQ |
|
|---|
| LysN LTQ |
|
|---|
| TryLysC LTQ |
|
|---|
| Try MSlow |
|
|---|
| ChTry MSlow |
|
|---|
| ArgC MSlow |
|
|---|
| LysN MSlow |
|
|---|
| TryLysC MSlow |
|
|---|
| Try MShigh |
|
|---|
| ChTry MShigh |
|
|---|
| ArgC MShigh |
|
|---|
| LysN MShigh |
|
|---|
| TryLysC MShigh |
|
|---|
General Statistics
Number of major isoforms |
Number of additional isoforms |
Number of all proteins |
Number of amino acids |
Min. Seq. Length |
Max. Seq. Length |
Avg. Seq. Length |
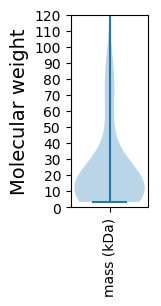
Avg. Mol. Weight |
|---|---|---|---|---|---|---|---|
0 |
12812 |
29 |
1551 |
224.8 |
24.81 |
Amino acid frequency
Ala |
Cys |
Asp |
Glu |
Phe |
Gly |
His |
Ile |
Lys |
Leu |
|---|---|---|---|---|---|---|---|---|---|
10.1 ± 0.371 | 0.952 ± 0.154 |
5.948 ± 0.273 | 6.72 ± 0.383 |
3.676 ± 0.192 | 8.125 ± 0.344 |
1.748 ± 0.2 | 4.644 ± 0.18 |
5.659 ± 0.348 | 8.5 ± 0.3 |
Met |
Asn |
Gln |
Pro |
Arg |
Ser |
Thr |
Val |
Trp |
Tyr |
|---|---|---|---|---|---|---|---|---|---|
2.318 ± 0.143 | 3.848 ± 0.285 |
4.558 ± 0.246 | 4.098 ± 0.247 |
5.893 ± 0.261 | 5.542 ± 0.37 |
5.924 ± 0.314 | 7.134 ± 0.244 |
1.342 ± 0.101 | 3.27 ± 0.206 |
Most of the basic statistics you can see at this page can be downloaded from this CSV file
See this proteome in:

Proteome-pI is available under Creative Commons Attribution-NoDerivs license, for more details see here
| Reference: Kozlowski LP. Proteome-pI 2.0: Proteome Isoelectric Point Database Update. Nucleic Acids Res. 2021, doi: 10.1093/nar/gkab944 | Contact: Lukasz P. Kozlowski |