Cupriavidus sp. UYMSc13B
Taxonomy: cellular organisms; Bacteria; Proteobacteria; Betaproteobacteria; Burkholderiales; Burkholderiaceae; Cupriavidus; unclassified Cupriavidus
Average proteome isoelectric point is 6.97
Get precalculated fractions of proteins
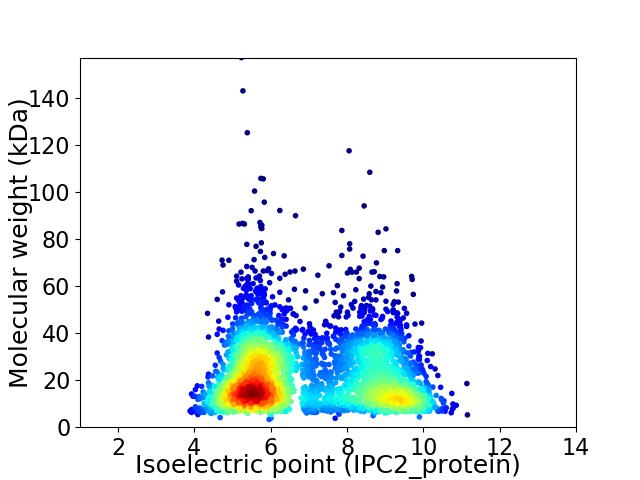
Virtual 2D-PAGE plot for 3607 proteins (isoelectric point calculated using IPC2_protein)
Get csv file with sequences according to given criteria:
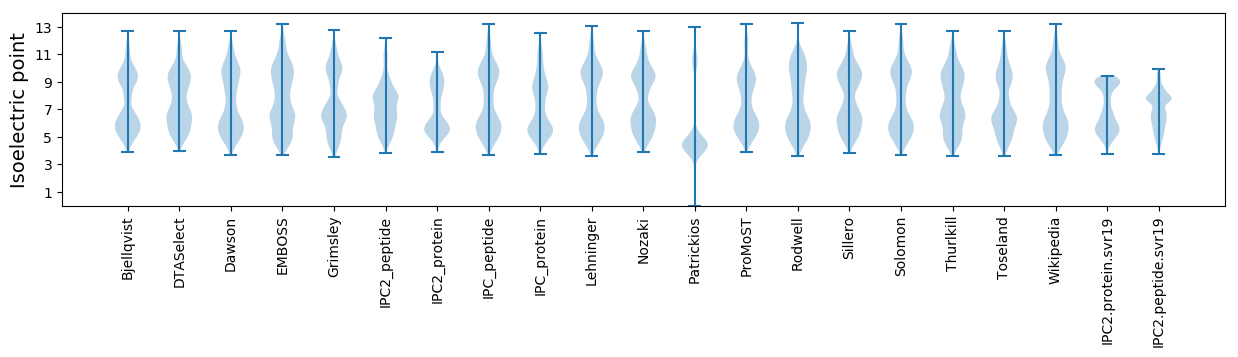
* You can choose from 21 different methods for calculating isoelectric point
Summary statistics related to proteome-wise predictions
Protein with the lowest isoelectric point:
>tr|A0A439EWM3|A0A439EWM3_9BURK Quinoprotein dehydrogenase-associated SoxYZ-like carrier OS=Cupriavidus sp. UYMSc13B OX=1774746 GN=AU476_38075 PE=4 SV=1
MM1 pKa = 7.05EE2 pKa = 5.21AAVAYY7 pKa = 6.74KK8 pKa = 9.43TWVCVICGWVYY19 pKa = 11.1DD20 pKa = 4.71EE21 pKa = 4.29EE22 pKa = 4.75QGWPDD27 pKa = 4.15DD28 pKa = 4.55GIAPGTRR35 pKa = 11.84WEE37 pKa = 5.63DD38 pKa = 3.21IPEE41 pKa = 3.98DD42 pKa = 3.85WRR44 pKa = 11.84CPEE47 pKa = 4.22CDD49 pKa = 3.03VGKK52 pKa = 10.91AEE54 pKa = 4.39FAMIEE59 pKa = 4.1LL60 pKa = 4.4
MM1 pKa = 7.05EE2 pKa = 5.21AAVAYY7 pKa = 6.74KK8 pKa = 9.43TWVCVICGWVYY19 pKa = 11.1DD20 pKa = 4.71EE21 pKa = 4.29EE22 pKa = 4.75QGWPDD27 pKa = 4.15DD28 pKa = 4.55GIAPGTRR35 pKa = 11.84WEE37 pKa = 5.63DD38 pKa = 3.21IPEE41 pKa = 3.98DD42 pKa = 3.85WRR44 pKa = 11.84CPEE47 pKa = 4.22CDD49 pKa = 3.03VGKK52 pKa = 10.91AEE54 pKa = 4.39FAMIEE59 pKa = 4.1LL60 pKa = 4.4
Molecular weight: 6.88 kDa
Isoelectric point according different methods:
Protein with the highest isoelectric point:
>tr|A0A439EY05|A0A439EY05_9BURK Fis family transcriptional regulator OS=Cupriavidus sp. UYMSc13B OX=1774746 GN=AU476_32010 PE=3 SV=1
MM1 pKa = 7.35KK2 pKa = 9.36RR3 pKa = 11.84TYY5 pKa = 10.06QPSVTRR11 pKa = 11.84RR12 pKa = 11.84KK13 pKa = 8.0RR14 pKa = 11.84THH16 pKa = 5.76GFRR19 pKa = 11.84VRR21 pKa = 11.84MKK23 pKa = 9.39TRR25 pKa = 11.84GGRR28 pKa = 11.84AVINARR34 pKa = 11.84RR35 pKa = 11.84AKK37 pKa = 9.65GRR39 pKa = 11.84KK40 pKa = 8.85RR41 pKa = 11.84LAII44 pKa = 4.0
MM1 pKa = 7.35KK2 pKa = 9.36RR3 pKa = 11.84TYY5 pKa = 10.06QPSVTRR11 pKa = 11.84RR12 pKa = 11.84KK13 pKa = 8.0RR14 pKa = 11.84THH16 pKa = 5.76GFRR19 pKa = 11.84VRR21 pKa = 11.84MKK23 pKa = 9.39TRR25 pKa = 11.84GGRR28 pKa = 11.84AVINARR34 pKa = 11.84RR35 pKa = 11.84AKK37 pKa = 9.65GRR39 pKa = 11.84KK40 pKa = 8.85RR41 pKa = 11.84LAII44 pKa = 4.0
Molecular weight: 5.22 kDa
Isoelectric point according different methods:
Peptides (in silico digests for buttom-up proteomics)
Below you can find in silico digests of the whole proteome with Trypsin, Chymotrypsin, Trypsin+LysC, LysN, ArgC proteases suitable for different mass spec machines.| Try ESI |
 |
|---|
| ChTry ESI |
|
|---|
| ArgC ESI |
|
|---|
| LysN ESI |
|
|---|
| TryLysC ESI |
|
|---|
| Try MALDI |
|
|---|
| ChTry MALDI |
|
|---|
| ArgC MALDI |
|
|---|
| LysN MALDI |
|
|---|
| TryLysC MALDI |
|
|---|
| Try LTQ |
|
|---|
| ChTry LTQ |
|
|---|
| ArgC LTQ |
|
|---|
| LysN LTQ |
|
|---|
| TryLysC LTQ |
|
|---|
| Try MSlow |
|
|---|
| ChTry MSlow |
|
|---|
| ArgC MSlow |
|
|---|
| LysN MSlow |
|
|---|
| TryLysC MSlow |
|
|---|
| Try MShigh |
|
|---|
| ChTry MShigh |
|
|---|
| ArgC MShigh |
|
|---|
| LysN MShigh |
|
|---|
| TryLysC MShigh |
|
|---|
General Statistics
Number of major isoforms |
Number of additional isoforms |
Number of all proteins |
Number of amino acids |
Min. Seq. Length |
Max. Seq. Length |
Avg. Seq. Length |
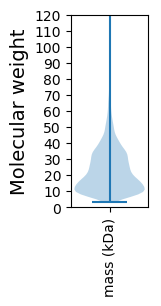
Avg. Mol. Weight |
|---|---|---|---|---|---|---|---|
0 |
782477 |
29 |
1552 |
216.9 |
23.67 |
Amino acid frequency
Ala |
Cys |
Asp |
Glu |
Phe |
Gly |
His |
Ile |
Lys |
Leu |
|---|---|---|---|---|---|---|---|---|---|
12.45 ± 0.07 | 1.116 ± 0.015 |
5.186 ± 0.034 | 5.227 ± 0.044 |
3.581 ± 0.029 | 8.099 ± 0.043 |
2.403 ± 0.024 | 4.552 ± 0.032 |
3.16 ± 0.039 | 10.205 ± 0.058 |
Met |
Asn |
Gln |
Pro |
Arg |
Ser |
Thr |
Val |
Trp |
Tyr |
|---|---|---|---|---|---|---|---|---|---|
2.658 ± 0.02 | 2.723 ± 0.03 |
5.134 ± 0.035 | 3.845 ± 0.028 |
7.313 ± 0.045 | 5.571 ± 0.038 |
5.299 ± 0.034 | 7.567 ± 0.036 |
1.462 ± 0.019 | 2.449 ± 0.024 |
Most of the basic statistics you can see at this page can be downloaded from this CSV file
See this proteome in:

Proteome-pI is available under Creative Commons Attribution-NoDerivs license, for more details see here
| Reference: Kozlowski LP. Proteome-pI 2.0: Proteome Isoelectric Point Database Update. Nucleic Acids Res. 2021, doi: 10.1093/nar/gkab944 | Contact: Lukasz P. Kozlowski |