Sphingomonas sp. MM-1
Taxonomy: cellular organisms; Bacteria; Proteobacteria; Alphaproteobacteria; Sphingomonadales; Sphingomonadaceae; Sphingomonas; unclassified Sphingomonas
Average proteome isoelectric point is 6.57
Get precalculated fractions of proteins
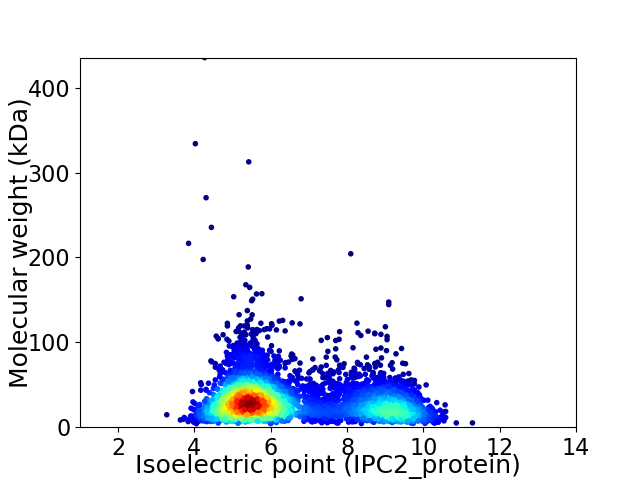
Virtual 2D-PAGE plot for 4252 proteins (isoelectric point calculated using IPC2_protein)
Get csv file with sequences according to given criteria:
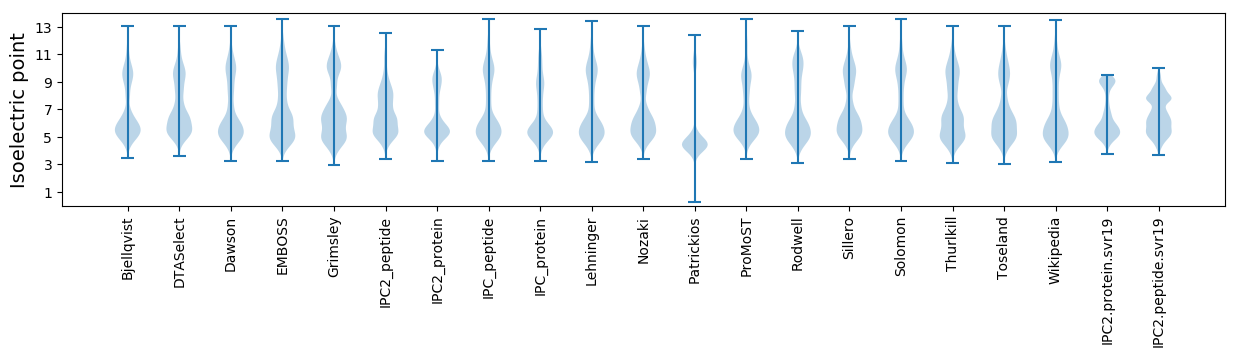
* You can choose from 21 different methods for calculating isoelectric point
Summary statistics related to proteome-wise predictions
Protein with the lowest isoelectric point:
>tr|M4RZT8|M4RZT8_9SPHN Alcohol dehydrogenase OS=Sphingomonas sp. MM-1 OX=745310 GN=G432_02300 PE=3 SV=1
MM1 pKa = 7.08QFLVPDD7 pKa = 4.3MTCGSCVPHH16 pKa = 5.78VTDD19 pKa = 6.51AIAKK23 pKa = 8.23VDD25 pKa = 3.71PGAVVEE31 pKa = 4.46ADD33 pKa = 3.54TVARR37 pKa = 11.84TITVTTSASQQEE49 pKa = 4.29IEE51 pKa = 4.8EE52 pKa = 4.43ALTDD56 pKa = 3.93DD57 pKa = 5.6GYY59 pKa = 10.34PATAII64 pKa = 3.91
MM1 pKa = 7.08QFLVPDD7 pKa = 4.3MTCGSCVPHH16 pKa = 5.78VTDD19 pKa = 6.51AIAKK23 pKa = 8.23VDD25 pKa = 3.71PGAVVEE31 pKa = 4.46ADD33 pKa = 3.54TVARR37 pKa = 11.84TITVTTSASQQEE49 pKa = 4.29IEE51 pKa = 4.8EE52 pKa = 4.43ALTDD56 pKa = 3.93DD57 pKa = 5.6GYY59 pKa = 10.34PATAII64 pKa = 3.91
Molecular weight: 6.65 kDa
Isoelectric point according different methods:
Protein with the highest isoelectric point:
>tr|M4SKR8|M4SKR8_9SPHN Phospholipase A1 OS=Sphingomonas sp. MM-1 OX=745310 GN=G432_17195 PE=3 SV=1
MM1 pKa = 7.45KK2 pKa = 9.56RR3 pKa = 11.84TFQPSRR9 pKa = 11.84LVRR12 pKa = 11.84KK13 pKa = 8.99RR14 pKa = 11.84RR15 pKa = 11.84HH16 pKa = 4.7GFRR19 pKa = 11.84SRR21 pKa = 11.84SATPGGRR28 pKa = 11.84KK29 pKa = 9.04VLAARR34 pKa = 11.84RR35 pKa = 11.84ARR37 pKa = 11.84GRR39 pKa = 11.84KK40 pKa = 6.76TLSAA44 pKa = 4.22
MM1 pKa = 7.45KK2 pKa = 9.56RR3 pKa = 11.84TFQPSRR9 pKa = 11.84LVRR12 pKa = 11.84KK13 pKa = 8.99RR14 pKa = 11.84RR15 pKa = 11.84HH16 pKa = 4.7GFRR19 pKa = 11.84SRR21 pKa = 11.84SATPGGRR28 pKa = 11.84KK29 pKa = 9.04VLAARR34 pKa = 11.84RR35 pKa = 11.84ARR37 pKa = 11.84GRR39 pKa = 11.84KK40 pKa = 6.76TLSAA44 pKa = 4.22
Molecular weight: 5.06 kDa
Isoelectric point according different methods:
Peptides (in silico digests for buttom-up proteomics)
Below you can find in silico digests of the whole proteome with Trypsin, Chymotrypsin, Trypsin+LysC, LysN, ArgC proteases suitable for different mass spec machines.| Try ESI |
 |
|---|
| ChTry ESI |
|
|---|
| ArgC ESI |
|
|---|
| LysN ESI |
|
|---|
| TryLysC ESI |
|
|---|
| Try MALDI |
|
|---|
| ChTry MALDI |
|
|---|
| ArgC MALDI |
|
|---|
| LysN MALDI |
|
|---|
| TryLysC MALDI |
|
|---|
| Try LTQ |
|
|---|
| ChTry LTQ |
|
|---|
| ArgC LTQ |
|
|---|
| LysN LTQ |
|
|---|
| TryLysC LTQ |
|
|---|
| Try MSlow |
|
|---|
| ChTry MSlow |
|
|---|
| ArgC MSlow |
|
|---|
| LysN MSlow |
|
|---|
| TryLysC MSlow |
|
|---|
| Try MShigh |
|
|---|
| ChTry MShigh |
|
|---|
| ArgC MShigh |
|
|---|
| LysN MShigh |
|
|---|
| TryLysC MShigh |
|
|---|
General Statistics
Number of major isoforms |
Number of additional isoforms |
Number of all proteins |
Number of amino acids |
Min. Seq. Length |
Max. Seq. Length |
Avg. Seq. Length |
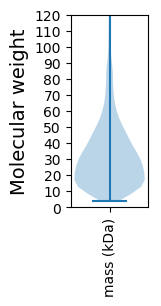
Avg. Mol. Weight |
|---|---|---|---|---|---|---|---|
0 |
1340665 |
36 |
4234 |
315.3 |
33.97 |
Amino acid frequency
Ala |
Cys |
Asp |
Glu |
Phe |
Gly |
His |
Ile |
Lys |
Leu |
|---|---|---|---|---|---|---|---|---|---|
14.144 ± 0.062 | 0.722 ± 0.013 |
6.063 ± 0.028 | 5.388 ± 0.039 |
3.447 ± 0.022 | 9.14 ± 0.057 |
1.967 ± 0.019 | 5.119 ± 0.027 |
2.731 ± 0.028 | 9.867 ± 0.04 |
Met |
Asn |
Gln |
Pro |
Arg |
Ser |
Thr |
Val |
Trp |
Tyr |
|---|---|---|---|---|---|---|---|---|---|
2.362 ± 0.019 | 2.411 ± 0.026 |
5.438 ± 0.033 | 2.925 ± 0.022 |
7.815 ± 0.042 | 4.869 ± 0.028 |
5.009 ± 0.035 | 7.003 ± 0.031 |
1.418 ± 0.016 | 2.161 ± 0.019 |
Most of the basic statistics you can see at this page can be downloaded from this CSV file
See this proteome in:

Proteome-pI is available under Creative Commons Attribution-NoDerivs license, for more details see here
| Reference: Kozlowski LP. Proteome-pI 2.0: Proteome Isoelectric Point Database Update. Nucleic Acids Res. 2021, doi: 10.1093/nar/gkab944 | Contact: Lukasz P. Kozlowski |