Mesobacillus zeae
Taxonomy: cellular organisms; Bacteria; Terrabacteria group; Firmicutes; Bacilli; Bacillales; Bacillaceae; Mesobacillus
Average proteome isoelectric point is 6.43
Get precalculated fractions of proteins
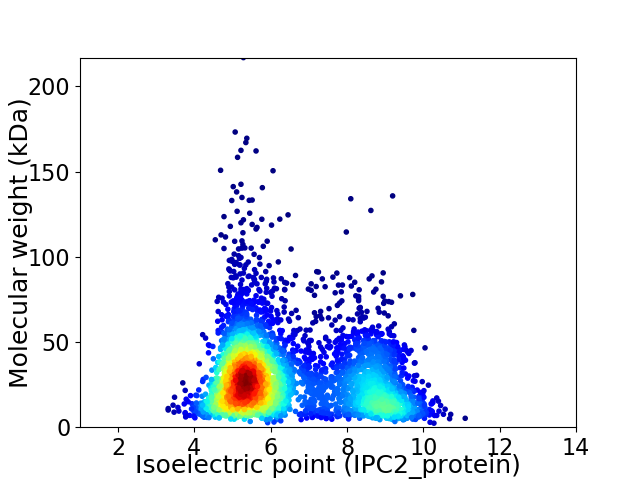
Virtual 2D-PAGE plot for 4175 proteins (isoelectric point calculated using IPC2_protein)
Get csv file with sequences according to given criteria:
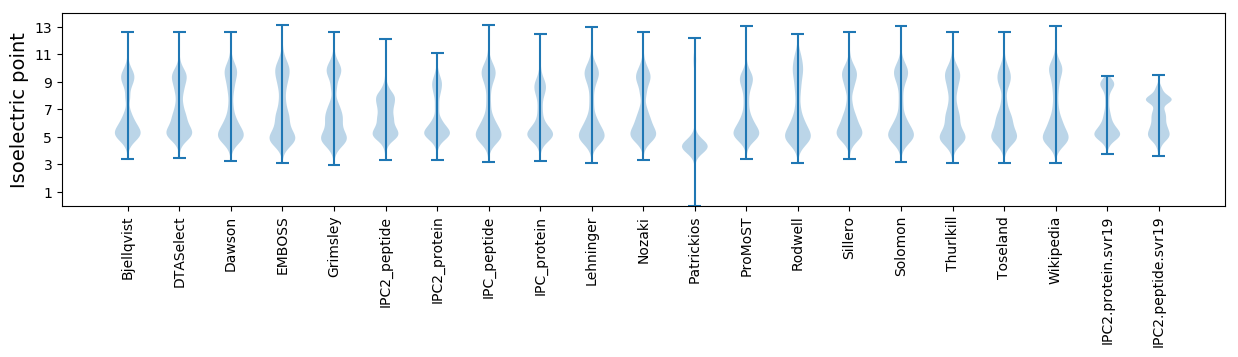
* You can choose from 21 different methods for calculating isoelectric point
Summary statistics related to proteome-wise predictions
Protein with the lowest isoelectric point:
>tr|A0A398BA51|A0A398BA51_9BACI N-acetyl-gamma-glutamyl-phosphate reductase OS=Mesobacillus zeae OX=1917180 GN=argC PE=3 SV=1
MM1 pKa = 7.52SGLAVIQDD9 pKa = 3.2IDD11 pKa = 3.82QLLEE15 pKa = 4.29YY16 pKa = 9.88INQPARR22 pKa = 11.84DD23 pKa = 4.09FHH25 pKa = 6.39QLWSDD30 pKa = 3.16IDD32 pKa = 3.6QLLPEE37 pKa = 5.03INQHH41 pKa = 4.84SQYY44 pKa = 11.02INQTLANPGIFPTDD58 pKa = 3.17NEE60 pKa = 4.22
MM1 pKa = 7.52SGLAVIQDD9 pKa = 3.2IDD11 pKa = 3.82QLLEE15 pKa = 4.29YY16 pKa = 9.88INQPARR22 pKa = 11.84DD23 pKa = 4.09FHH25 pKa = 6.39QLWSDD30 pKa = 3.16IDD32 pKa = 3.6QLLPEE37 pKa = 5.03INQHH41 pKa = 4.84SQYY44 pKa = 11.02INQTLANPGIFPTDD58 pKa = 3.17NEE60 pKa = 4.22
Molecular weight: 6.92 kDa
Isoelectric point according different methods:
Protein with the highest isoelectric point:
>tr|A0A398BCW6|A0A398BCW6_9BACI DUF2515 domain-containing protein OS=Mesobacillus zeae OX=1917180 GN=D1970_07985 PE=4 SV=1
MM1 pKa = 7.35KK2 pKa = 9.42RR3 pKa = 11.84TYY5 pKa = 10.24QPNKK9 pKa = 8.16RR10 pKa = 11.84KK11 pKa = 9.54HH12 pKa = 5.99SKK14 pKa = 8.79VHH16 pKa = 5.85GFRR19 pKa = 11.84SRR21 pKa = 11.84MSSANGRR28 pKa = 11.84KK29 pKa = 8.82VLARR33 pKa = 11.84RR34 pKa = 11.84RR35 pKa = 11.84RR36 pKa = 11.84KK37 pKa = 9.05GRR39 pKa = 11.84KK40 pKa = 8.7VLSAA44 pKa = 4.05
MM1 pKa = 7.35KK2 pKa = 9.42RR3 pKa = 11.84TYY5 pKa = 10.24QPNKK9 pKa = 8.16RR10 pKa = 11.84KK11 pKa = 9.54HH12 pKa = 5.99SKK14 pKa = 8.79VHH16 pKa = 5.85GFRR19 pKa = 11.84SRR21 pKa = 11.84MSSANGRR28 pKa = 11.84KK29 pKa = 8.82VLARR33 pKa = 11.84RR34 pKa = 11.84RR35 pKa = 11.84RR36 pKa = 11.84KK37 pKa = 9.05GRR39 pKa = 11.84KK40 pKa = 8.7VLSAA44 pKa = 4.05
Molecular weight: 5.22 kDa
Isoelectric point according different methods:
Peptides (in silico digests for buttom-up proteomics)
Below you can find in silico digests of the whole proteome with Trypsin, Chymotrypsin, Trypsin+LysC, LysN, ArgC proteases suitable for different mass spec machines.| Try ESI |
 |
|---|
| ChTry ESI |
|
|---|
| ArgC ESI |
|
|---|
| LysN ESI |
|
|---|
| TryLysC ESI |
|
|---|
| Try MALDI |
|
|---|
| ChTry MALDI |
|
|---|
| ArgC MALDI |
|
|---|
| LysN MALDI |
|
|---|
| TryLysC MALDI |
|
|---|
| Try LTQ |
|
|---|
| ChTry LTQ |
|
|---|
| ArgC LTQ |
|
|---|
| LysN LTQ |
|
|---|
| TryLysC LTQ |
|
|---|
| Try MSlow |
|
|---|
| ChTry MSlow |
|
|---|
| ArgC MSlow |
|
|---|
| LysN MSlow |
|
|---|
| TryLysC MSlow |
|
|---|
| Try MShigh |
|
|---|
| ChTry MShigh |
|
|---|
| ArgC MShigh |
|
|---|
| LysN MShigh |
|
|---|
| TryLysC MShigh |
|
|---|
General Statistics
Number of major isoforms |
Number of additional isoforms |
Number of all proteins |
Number of amino acids |
Min. Seq. Length |
Max. Seq. Length |
Avg. Seq. Length |
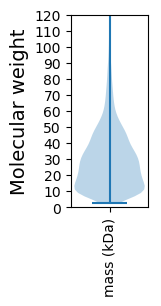
Avg. Mol. Weight |
|---|---|---|---|---|---|---|---|
0 |
1151873 |
21 |
1893 |
275.9 |
30.86 |
Amino acid frequency
Ala |
Cys |
Asp |
Glu |
Phe |
Gly |
His |
Ile |
Lys |
Leu |
|---|---|---|---|---|---|---|---|---|---|
7.496 ± 0.047 | 0.779 ± 0.014 |
5.022 ± 0.032 | 7.56 ± 0.047 |
4.593 ± 0.037 | 7.349 ± 0.041 |
2.002 ± 0.019 | 7.462 ± 0.037 |
7.038 ± 0.039 | 9.759 ± 0.048 |
Met |
Asn |
Gln |
Pro |
Arg |
Ser |
Thr |
Val |
Trp |
Tyr |
|---|---|---|---|---|---|---|---|---|---|
2.889 ± 0.02 | 4.123 ± 0.027 |
3.661 ± 0.023 | 3.338 ± 0.025 |
4.352 ± 0.027 | 6.179 ± 0.027 |
5.123 ± 0.022 | 6.873 ± 0.031 |
0.994 ± 0.013 | 3.41 ± 0.025 |
Most of the basic statistics you can see at this page can be downloaded from this CSV file
See this proteome in:

Proteome-pI is available under Creative Commons Attribution-NoDerivs license, for more details see here
| Reference: Kozlowski LP. Proteome-pI 2.0: Proteome Isoelectric Point Database Update. Nucleic Acids Res. 2021, doi: 10.1093/nar/gkab944 | Contact: Lukasz P. Kozlowski |