Listeria monocytogenes serovar 1/2a (strain ATCC BAA-679 / EGD-e)
Taxonomy: cellular organisms; Bacteria; Terrabacteria group; Firmicutes; Bacilli; Bacillales; Listeriaceae; Listeria; Listeria monocytogenes
Average proteome isoelectric point is 6.07
Get precalculated fractions of proteins
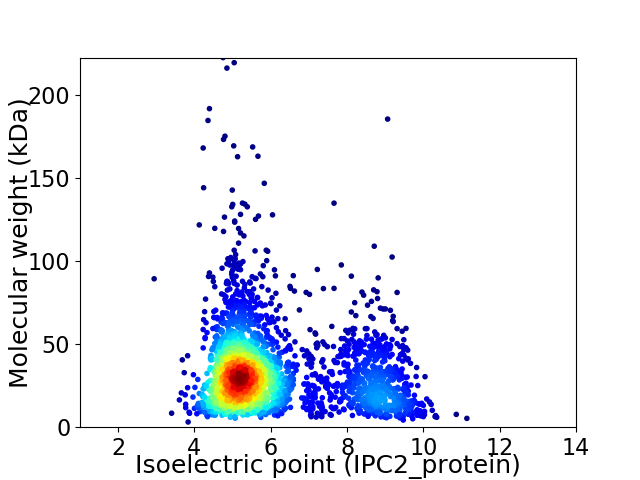
Virtual 2D-PAGE plot for 2844 proteins (isoelectric point calculated using IPC2_protein)
Get csv file with sequences according to given criteria:
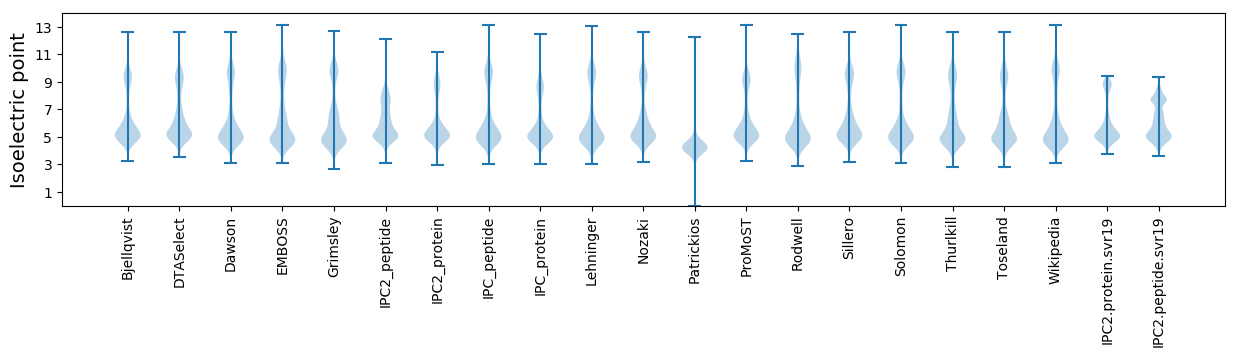
* You can choose from 21 different methods for calculating isoelectric point
Summary statistics related to proteome-wise predictions
Protein with the lowest isoelectric point:
>tr|Q8Y5S7|Q8Y5S7_LISMO Glucose-6-phosphate 1-dehydrogenase OS=Listeria monocytogenes serovar 1/2a (strain ATCC BAA-679 / EGD-e) OX=169963 GN=zwf PE=3 SV=1
MM1 pKa = 7.42KK2 pKa = 10.35KK3 pKa = 9.79ILTGLSTTLLLTVLLLTITGGDD25 pKa = 3.84LKK27 pKa = 11.27AKK29 pKa = 9.85AASDD33 pKa = 4.66LYY35 pKa = 10.17PLPAPIIDD43 pKa = 3.65VFPDD47 pKa = 2.87EE48 pKa = 5.43GLAKK52 pKa = 10.8DD53 pKa = 3.47MAKK56 pKa = 10.48NLNKK60 pKa = 10.62DD61 pKa = 3.45SVNDD65 pKa = 4.51VIDD68 pKa = 4.12QDD70 pKa = 5.27DD71 pKa = 4.27LDD73 pKa = 4.76ALTGLGFEE81 pKa = 5.06TEE83 pKa = 4.53TITNDD88 pKa = 3.19SMQLLEE94 pKa = 4.23RR95 pKa = 11.84AMFNNVNIVSVMEE108 pKa = 4.23FGEE111 pKa = 4.6DD112 pKa = 3.13LTEE115 pKa = 4.73FPDD118 pKa = 3.76ISTIPHH124 pKa = 7.06LNTLFFNTPPEE135 pKa = 4.32GVTRR139 pKa = 11.84NLSLPDD145 pKa = 3.48YY146 pKa = 10.41QNYY149 pKa = 9.91PEE151 pKa = 4.57MVTITMSGSNLIGAIPDD168 pKa = 3.71FTGMPDD174 pKa = 4.03LSQLYY179 pKa = 8.27MADD182 pKa = 3.42MMITSDD188 pKa = 4.94DD189 pKa = 3.69VPDD192 pKa = 3.89FHH194 pKa = 7.19TIPKK198 pKa = 10.39LSTLDD203 pKa = 3.7LSHH206 pKa = 6.73NQLTNLPDD214 pKa = 3.92FQNLTNLAEE223 pKa = 4.65LNLSFNNLTNTMTNFTNLSNLNNLNLDD250 pKa = 3.9YY251 pKa = 11.52NHH253 pKa = 7.05LNEE256 pKa = 5.25LPSNVLNSIFIEE268 pKa = 4.34NQSGTVPDD276 pKa = 3.91QIIKK280 pKa = 10.44QGEE283 pKa = 4.39TCTIQLPIYY292 pKa = 9.44FQLAEE297 pKa = 4.22INMLVNPTVLGSYY310 pKa = 9.97SADD313 pKa = 3.0IPVEE317 pKa = 4.2VVTTTNADD325 pKa = 3.73TEE327 pKa = 5.01SITLDD332 pKa = 3.36TSEE335 pKa = 5.2LSPGVYY341 pKa = 10.18NFNVQFNDD349 pKa = 3.92AYY351 pKa = 10.13PITQEE356 pKa = 3.76GCVYY360 pKa = 10.99DD361 pKa = 3.5WVLTVNN367 pKa = 4.06
MM1 pKa = 7.42KK2 pKa = 10.35KK3 pKa = 9.79ILTGLSTTLLLTVLLLTITGGDD25 pKa = 3.84LKK27 pKa = 11.27AKK29 pKa = 9.85AASDD33 pKa = 4.66LYY35 pKa = 10.17PLPAPIIDD43 pKa = 3.65VFPDD47 pKa = 2.87EE48 pKa = 5.43GLAKK52 pKa = 10.8DD53 pKa = 3.47MAKK56 pKa = 10.48NLNKK60 pKa = 10.62DD61 pKa = 3.45SVNDD65 pKa = 4.51VIDD68 pKa = 4.12QDD70 pKa = 5.27DD71 pKa = 4.27LDD73 pKa = 4.76ALTGLGFEE81 pKa = 5.06TEE83 pKa = 4.53TITNDD88 pKa = 3.19SMQLLEE94 pKa = 4.23RR95 pKa = 11.84AMFNNVNIVSVMEE108 pKa = 4.23FGEE111 pKa = 4.6DD112 pKa = 3.13LTEE115 pKa = 4.73FPDD118 pKa = 3.76ISTIPHH124 pKa = 7.06LNTLFFNTPPEE135 pKa = 4.32GVTRR139 pKa = 11.84NLSLPDD145 pKa = 3.48YY146 pKa = 10.41QNYY149 pKa = 9.91PEE151 pKa = 4.57MVTITMSGSNLIGAIPDD168 pKa = 3.71FTGMPDD174 pKa = 4.03LSQLYY179 pKa = 8.27MADD182 pKa = 3.42MMITSDD188 pKa = 4.94DD189 pKa = 3.69VPDD192 pKa = 3.89FHH194 pKa = 7.19TIPKK198 pKa = 10.39LSTLDD203 pKa = 3.7LSHH206 pKa = 6.73NQLTNLPDD214 pKa = 3.92FQNLTNLAEE223 pKa = 4.65LNLSFNNLTNTMTNFTNLSNLNNLNLDD250 pKa = 3.9YY251 pKa = 11.52NHH253 pKa = 7.05LNEE256 pKa = 5.25LPSNVLNSIFIEE268 pKa = 4.34NQSGTVPDD276 pKa = 3.91QIIKK280 pKa = 10.44QGEE283 pKa = 4.39TCTIQLPIYY292 pKa = 9.44FQLAEE297 pKa = 4.22INMLVNPTVLGSYY310 pKa = 9.97SADD313 pKa = 3.0IPVEE317 pKa = 4.2VVTTTNADD325 pKa = 3.73TEE327 pKa = 5.01SITLDD332 pKa = 3.36TSEE335 pKa = 5.2LSPGVYY341 pKa = 10.18NFNVQFNDD349 pKa = 3.92AYY351 pKa = 10.13PITQEE356 pKa = 3.76GCVYY360 pKa = 10.99DD361 pKa = 3.5WVLTVNN367 pKa = 4.06
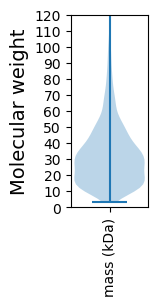
Molecular weight: 40.51 kDa
Isoelectric point according different methods:
Protein with the highest isoelectric point:
>tr|Q7AP96|Q7AP96_LISMO LmaD protein OS=Listeria monocytogenes serovar 1/2a (strain ATCC BAA-679 / EGD-e) OX=169963 GN=lmaD PE=4 SV=1
MM1 pKa = 7.35KK2 pKa = 9.43RR3 pKa = 11.84TYY5 pKa = 10.29QPSKK9 pKa = 9.59RR10 pKa = 11.84KK11 pKa = 9.09RR12 pKa = 11.84KK13 pKa = 8.86KK14 pKa = 8.28VHH16 pKa = 5.49GFRR19 pKa = 11.84TRR21 pKa = 11.84MSTKK25 pKa = 9.32NGRR28 pKa = 11.84RR29 pKa = 11.84VLASRR34 pKa = 11.84RR35 pKa = 11.84RR36 pKa = 11.84KK37 pKa = 8.73GRR39 pKa = 11.84KK40 pKa = 8.76VLSAA44 pKa = 4.05
MM1 pKa = 7.35KK2 pKa = 9.43RR3 pKa = 11.84TYY5 pKa = 10.29QPSKK9 pKa = 9.59RR10 pKa = 11.84KK11 pKa = 9.09RR12 pKa = 11.84KK13 pKa = 8.86KK14 pKa = 8.28VHH16 pKa = 5.49GFRR19 pKa = 11.84TRR21 pKa = 11.84MSTKK25 pKa = 9.32NGRR28 pKa = 11.84RR29 pKa = 11.84VLASRR34 pKa = 11.84RR35 pKa = 11.84RR36 pKa = 11.84KK37 pKa = 8.73GRR39 pKa = 11.84KK40 pKa = 8.76VLSAA44 pKa = 4.05
Molecular weight: 5.3 kDa
Isoelectric point according different methods:
Peptides (in silico digests for buttom-up proteomics)
Below you can find in silico digests of the whole proteome with Trypsin, Chymotrypsin, Trypsin+LysC, LysN, ArgC proteases suitable for different mass spec machines.| Try ESI |
 |
|---|
| ChTry ESI |
|
|---|
| ArgC ESI |
|
|---|
| LysN ESI |
|
|---|
| TryLysC ESI |
|
|---|
| Try MALDI |
|
|---|
| ChTry MALDI |
|
|---|
| ArgC MALDI |
|
|---|
| LysN MALDI |
|
|---|
| TryLysC MALDI |
|
|---|
| Try LTQ |
|
|---|
| ChTry LTQ |
|
|---|
| ArgC LTQ |
|
|---|
| LysN LTQ |
|
|---|
| TryLysC LTQ |
|
|---|
| Try MSlow |
|
|---|
| ChTry MSlow |
|
|---|
| ArgC MSlow |
|
|---|
| LysN MSlow |
|
|---|
| TryLysC MSlow |
|
|---|
| Try MShigh |
|
|---|
| ChTry MShigh |
|
|---|
| ArgC MShigh |
|
|---|
| LysN MShigh |
|
|---|
| TryLysC MShigh |
|
|---|
General Statistics
Number of major isoforms |
Number of additional isoforms |
Number of all proteins |
Number of amino acids |
Min. Seq. Length |
Max. Seq. Length |
Avg. Seq. Length |
Avg. Mol. Weight |
|---|---|---|---|---|---|---|---|
0 |
870843 |
28 |
2044 |
306.2 |
34.21 |
Amino acid frequency
Ala |
Cys |
Asp |
Glu |
Phe |
Gly |
His |
Ile |
Lys |
Leu |
|---|---|---|---|---|---|---|---|---|---|
7.737 ± 0.051 | 0.609 ± 0.013 |
5.445 ± 0.048 | 7.439 ± 0.06 |
4.531 ± 0.039 | 6.671 ± 0.046 |
1.779 ± 0.019 | 7.84 ± 0.053 |
7.163 ± 0.04 | 9.506 ± 0.048 |
Met |
Asn |
Gln |
Pro |
Arg |
Ser |
Thr |
Val |
Trp |
Tyr |
|---|---|---|---|---|---|---|---|---|---|
2.746 ± 0.022 | 4.621 ± 0.036 |
3.472 ± 0.027 | 3.457 ± 0.029 |
3.652 ± 0.038 | 5.799 ± 0.033 |
6.114 ± 0.055 | 7.041 ± 0.04 |
0.93 ± 0.018 | 3.448 ± 0.027 |
Most of the basic statistics you can see at this page can be downloaded from this CSV file
See this proteome in:

Proteome-pI is available under Creative Commons Attribution-NoDerivs license, for more details see here
| Reference: Kozlowski LP. Proteome-pI 2.0: Proteome Isoelectric Point Database Update. Nucleic Acids Res. 2021, doi: 10.1093/nar/gkab944 | Contact: Lukasz P. Kozlowski |