Sweetwater Branch virus
Taxonomy: Viruses; Riboviria; Orthornavirae; Negarnaviricota; Haploviricotina; Monjiviricetes; Mononegavirales; Rhabdoviridae; Alpharhabdovirinae; Tibrovirus; Sweetwater Branch tibrovirus
Average proteome isoelectric point is 6.65
Get precalculated fractions of proteins
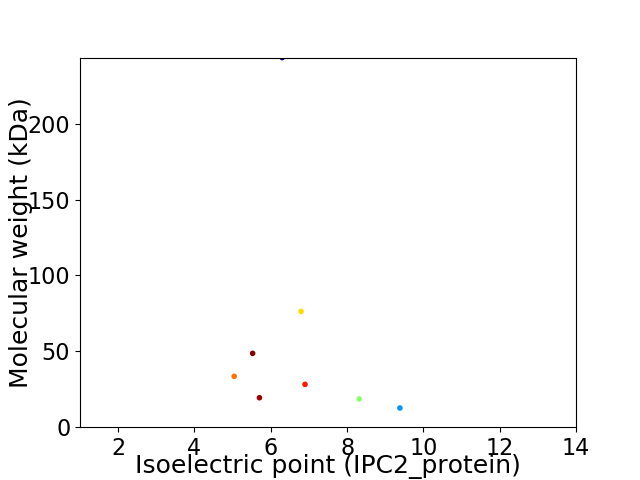
Virtual 2D-PAGE plot for 8 proteins (isoelectric point calculated using IPC2_protein)
Get csv file with sequences according to given criteria:
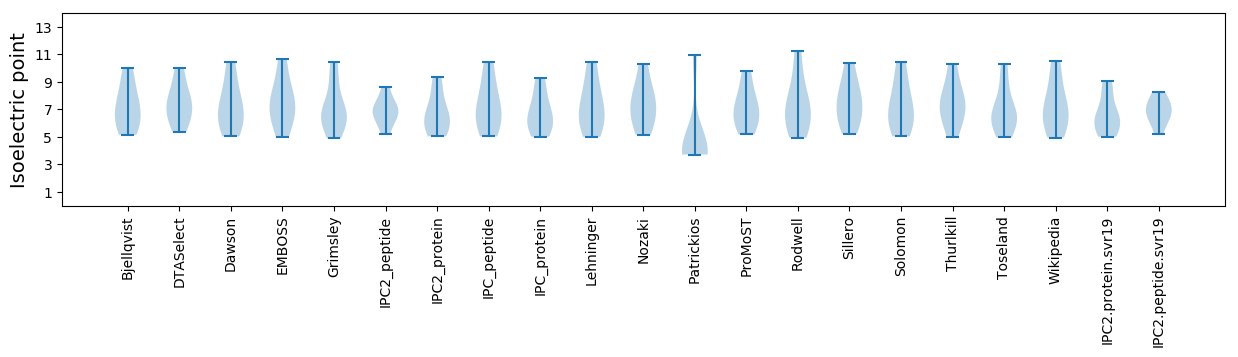
* You can choose from 21 different methods for calculating isoelectric point
Summary statistics related to proteome-wise predictions

Protein with the lowest isoelectric point:
>tr|A0A0D3R1K9|A0A0D3R1K9_9RHAB Matrix OS=Sweetwater Branch virus OX=1272958 PE=4 SV=1
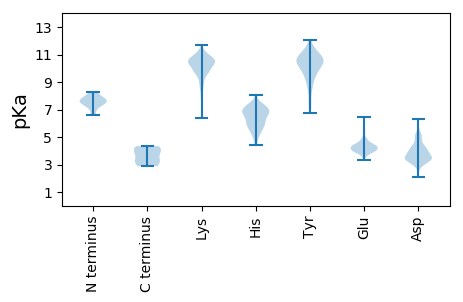
MM1 pKa = 6.6QRR3 pKa = 11.84QRR5 pKa = 11.84ISIPYY10 pKa = 7.75VTDD13 pKa = 4.16SILTDD18 pKa = 3.32ASKK21 pKa = 11.0AHH23 pKa = 7.05DD24 pKa = 4.31PNEE27 pKa = 4.17VQDD30 pKa = 4.12NEE32 pKa = 4.75SIPTIKK38 pKa = 10.14ILPGLSGDD46 pKa = 3.52QKK48 pKa = 11.42LNEE51 pKa = 4.34LLDD54 pKa = 3.79SRR56 pKa = 11.84EE57 pKa = 4.02LNFRR61 pKa = 11.84TRR63 pKa = 11.84ASSTSSYY70 pKa = 11.54DD71 pKa = 3.41DD72 pKa = 5.05DD73 pKa = 5.03DD74 pKa = 3.92WAEE77 pKa = 4.19SIIDD81 pKa = 3.92LSKK84 pKa = 10.68KK85 pKa = 10.58DD86 pKa = 3.55EE87 pKa = 4.54STTHH91 pKa = 6.69NYY93 pKa = 9.23QKK95 pKa = 11.09GGDD98 pKa = 3.56NSYY101 pKa = 10.91KK102 pKa = 10.9SKK104 pKa = 9.98DD105 pKa = 3.24TSADD109 pKa = 3.36LDD111 pKa = 3.88TPPNKK116 pKa = 9.53KK117 pKa = 10.24DD118 pKa = 3.47SASCTTNDD126 pKa = 3.68ASNLQSIQEE135 pKa = 4.14ANVFDD140 pKa = 4.22TSHH143 pKa = 7.43LYY145 pKa = 10.11PLMEE149 pKa = 4.86LPHH152 pKa = 6.53SFSHH156 pKa = 7.21CIPKK160 pKa = 10.08LQFFLKK166 pKa = 10.49YY167 pKa = 9.14YY168 pKa = 10.73NLYY171 pKa = 10.43EE172 pKa = 4.41DD173 pKa = 3.24VDD175 pKa = 4.13YY176 pKa = 11.69VIDD179 pKa = 4.09KK180 pKa = 11.18DD181 pKa = 3.48NTKK184 pKa = 10.97YY185 pKa = 11.06YY186 pKa = 10.4FFPTKK191 pKa = 10.04KK192 pKa = 8.86WLQGPEE198 pKa = 4.01EE199 pKa = 4.55YY200 pKa = 10.0EE201 pKa = 4.4VRR203 pKa = 11.84TSDD206 pKa = 4.47HH207 pKa = 7.0PIEE210 pKa = 5.41SEE212 pKa = 4.58DD213 pKa = 3.32VTEE216 pKa = 4.12EE217 pKa = 3.85HH218 pKa = 6.95GEE220 pKa = 4.06VHH222 pKa = 6.85ALLDD226 pKa = 3.92FLSKK230 pKa = 10.77GFYY233 pKa = 9.38VEE235 pKa = 3.91KK236 pKa = 10.74RR237 pKa = 11.84NIKK240 pKa = 9.37GKK242 pKa = 11.02YY243 pKa = 9.39YY244 pKa = 10.71FDD246 pKa = 5.17LNNPSLNVNKK256 pKa = 9.93IAKK259 pKa = 9.37QDD261 pKa = 3.51GDD263 pKa = 3.46AHH265 pKa = 6.03GWSDD269 pKa = 3.72SKK271 pKa = 11.35KK272 pKa = 9.42IDD274 pKa = 4.54AIFKK278 pKa = 10.39ASGIYY283 pKa = 9.79RR284 pKa = 11.84AMRR287 pKa = 11.84LKK289 pKa = 10.87AKK291 pKa = 8.75WW292 pKa = 3.07
MM1 pKa = 6.6QRR3 pKa = 11.84QRR5 pKa = 11.84ISIPYY10 pKa = 7.75VTDD13 pKa = 4.16SILTDD18 pKa = 3.32ASKK21 pKa = 11.0AHH23 pKa = 7.05DD24 pKa = 4.31PNEE27 pKa = 4.17VQDD30 pKa = 4.12NEE32 pKa = 4.75SIPTIKK38 pKa = 10.14ILPGLSGDD46 pKa = 3.52QKK48 pKa = 11.42LNEE51 pKa = 4.34LLDD54 pKa = 3.79SRR56 pKa = 11.84EE57 pKa = 4.02LNFRR61 pKa = 11.84TRR63 pKa = 11.84ASSTSSYY70 pKa = 11.54DD71 pKa = 3.41DD72 pKa = 5.05DD73 pKa = 5.03DD74 pKa = 3.92WAEE77 pKa = 4.19SIIDD81 pKa = 3.92LSKK84 pKa = 10.68KK85 pKa = 10.58DD86 pKa = 3.55EE87 pKa = 4.54STTHH91 pKa = 6.69NYY93 pKa = 9.23QKK95 pKa = 11.09GGDD98 pKa = 3.56NSYY101 pKa = 10.91KK102 pKa = 10.9SKK104 pKa = 9.98DD105 pKa = 3.24TSADD109 pKa = 3.36LDD111 pKa = 3.88TPPNKK116 pKa = 9.53KK117 pKa = 10.24DD118 pKa = 3.47SASCTTNDD126 pKa = 3.68ASNLQSIQEE135 pKa = 4.14ANVFDD140 pKa = 4.22TSHH143 pKa = 7.43LYY145 pKa = 10.11PLMEE149 pKa = 4.86LPHH152 pKa = 6.53SFSHH156 pKa = 7.21CIPKK160 pKa = 10.08LQFFLKK166 pKa = 10.49YY167 pKa = 9.14YY168 pKa = 10.73NLYY171 pKa = 10.43EE172 pKa = 4.41DD173 pKa = 3.24VDD175 pKa = 4.13YY176 pKa = 11.69VIDD179 pKa = 4.09KK180 pKa = 11.18DD181 pKa = 3.48NTKK184 pKa = 10.97YY185 pKa = 11.06YY186 pKa = 10.4FFPTKK191 pKa = 10.04KK192 pKa = 8.86WLQGPEE198 pKa = 4.01EE199 pKa = 4.55YY200 pKa = 10.0EE201 pKa = 4.4VRR203 pKa = 11.84TSDD206 pKa = 4.47HH207 pKa = 7.0PIEE210 pKa = 5.41SEE212 pKa = 4.58DD213 pKa = 3.32VTEE216 pKa = 4.12EE217 pKa = 3.85HH218 pKa = 6.95GEE220 pKa = 4.06VHH222 pKa = 6.85ALLDD226 pKa = 3.92FLSKK230 pKa = 10.77GFYY233 pKa = 9.38VEE235 pKa = 3.91KK236 pKa = 10.74RR237 pKa = 11.84NIKK240 pKa = 9.37GKK242 pKa = 11.02YY243 pKa = 9.39YY244 pKa = 10.71FDD246 pKa = 5.17LNNPSLNVNKK256 pKa = 9.93IAKK259 pKa = 9.37QDD261 pKa = 3.51GDD263 pKa = 3.46AHH265 pKa = 6.03GWSDD269 pKa = 3.72SKK271 pKa = 11.35KK272 pKa = 9.42IDD274 pKa = 4.54AIFKK278 pKa = 10.39ASGIYY283 pKa = 9.79RR284 pKa = 11.84AMRR287 pKa = 11.84LKK289 pKa = 10.87AKK291 pKa = 8.75WW292 pKa = 3.07
Molecular weight: 33.51 kDa
Isoelectric point according different methods:
Protein with the highest isoelectric point:
>tr|A0A0D3R1P9|A0A0D3R1P9_9RHAB Uncharacterized protein OS=Sweetwater Branch virus OX=1272958 PE=4 SV=1
MM1 pKa = 7.66EE2 pKa = 5.43LPKK5 pKa = 10.73SFNLQIDD12 pKa = 4.02YY13 pKa = 11.43NNIWNQISSRR23 pKa = 11.84ISPIWHH29 pKa = 6.39QIKK32 pKa = 9.54KK33 pKa = 8.71WSIIVFILFLTICIVKK49 pKa = 9.59IGKK52 pKa = 9.7FIFQCIKK59 pKa = 9.6IFKK62 pKa = 8.64WLANSVFNYY71 pKa = 9.45MRR73 pKa = 11.84ICFKK77 pKa = 10.75QLSKK81 pKa = 10.71KK82 pKa = 9.86IKK84 pKa = 9.78PKK86 pKa = 10.32QSPQKK91 pKa = 9.4TIYY94 pKa = 9.78KK95 pKa = 9.99DD96 pKa = 3.14RR97 pKa = 11.84SKK99 pKa = 11.29EE100 pKa = 4.04VILDD104 pKa = 3.55VV105 pKa = 4.34
MM1 pKa = 7.66EE2 pKa = 5.43LPKK5 pKa = 10.73SFNLQIDD12 pKa = 4.02YY13 pKa = 11.43NNIWNQISSRR23 pKa = 11.84ISPIWHH29 pKa = 6.39QIKK32 pKa = 9.54KK33 pKa = 8.71WSIIVFILFLTICIVKK49 pKa = 9.59IGKK52 pKa = 9.7FIFQCIKK59 pKa = 9.6IFKK62 pKa = 8.64WLANSVFNYY71 pKa = 9.45MRR73 pKa = 11.84ICFKK77 pKa = 10.75QLSKK81 pKa = 10.71KK82 pKa = 9.86IKK84 pKa = 9.78PKK86 pKa = 10.32QSPQKK91 pKa = 9.4TIYY94 pKa = 9.78KK95 pKa = 9.99DD96 pKa = 3.14RR97 pKa = 11.84SKK99 pKa = 11.29EE100 pKa = 4.04VILDD104 pKa = 3.55VV105 pKa = 4.34
Molecular weight: 12.66 kDa
Isoelectric point according different methods:
Peptides (in silico digests for buttom-up proteomics)
Below you can find in silico digests of the whole proteome with Trypsin, Chymotrypsin, Trypsin+LysC, LysN, ArgC proteases suitable for different mass spec machines.| Try ESI |
 |
|---|
| ChTry ESI |
|
|---|
| ArgC ESI |
|
|---|
| LysN ESI |
|
|---|
| TryLysC ESI |
|
|---|
| Try MALDI |
|
|---|
| ChTry MALDI |
|
|---|
| ArgC MALDI |
|
|---|
| LysN MALDI |
|
|---|
| TryLysC MALDI |
|
|---|
| Try LTQ |
|
|---|
| ChTry LTQ |
|
|---|
| ArgC LTQ |
|
|---|
| LysN LTQ |
|
|---|
| TryLysC LTQ |
|
|---|
| Try MSlow |
|
|---|
| ChTry MSlow |
|
|---|
| ArgC MSlow |
|
|---|
| LysN MSlow |
|
|---|
| TryLysC MSlow |
|
|---|
| Try MShigh |
|
|---|
| ChTry MShigh |
|
|---|
| ArgC MShigh |
|
|---|
| LysN MShigh |
|
|---|
| TryLysC MShigh |
|
|---|
General Statistics
Number of major isoforms |
Number of additional isoforms |
Number of all proteins |
Number of amino acids |
Min. Seq. Length |
Max. Seq. Length |
Avg. Seq. Length |
Avg. Mol. Weight |
|---|---|---|---|---|---|---|---|
0 |
4187 |
105 |
2120 |
523.4 |
60.1 |
Amino acid frequency
Ala |
Cys |
Asp |
Glu |
Phe |
Gly |
His |
Ile |
Lys |
Leu |
|---|---|---|---|---|---|---|---|---|---|
3.559 ± 0.416 | 2.054 ± 0.275 |
6.472 ± 0.67 | 5.35 ± 0.251 |
4.227 ± 0.212 | 5.063 ± 0.321 |
2.747 ± 0.271 | 8.073 ± 0.634 |
7.523 ± 0.675 | 10.103 ± 1.012 |
Met |
Asn |
Gln |
Pro |
Arg |
Ser |
Thr |
Val |
Trp |
Tyr |
|---|---|---|---|---|---|---|---|---|---|
2.173 ± 0.303 | 6.281 ± 0.259 |
3.845 ± 0.191 | 3.129 ± 0.291 |
3.989 ± 0.382 | 8.574 ± 0.449 |
5.445 ± 0.32 | 5.087 ± 0.271 |
1.791 ± 0.114 | 4.514 ± 0.466 |
Most of the basic statistics you can see at this page can be downloaded from this CSV file
See this proteome in:

Proteome-pI is available under Creative Commons Attribution-NoDerivs license, for more details see here
| Reference: Kozlowski LP. Proteome-pI 2.0: Proteome Isoelectric Point Database Update. Nucleic Acids Res. 2021, doi: 10.1093/nar/gkab944 | Contact: Lukasz P. Kozlowski |