Anditalea andensis
Taxonomy: cellular organisms; Bacteria; FCB group; Bacteroidetes/Chlorobi group; Bacteroidetes; Cytophagia; Cytophagales; Cytophagaceae; Anditalea
Average proteome isoelectric point is 6.28
Get precalculated fractions of proteins
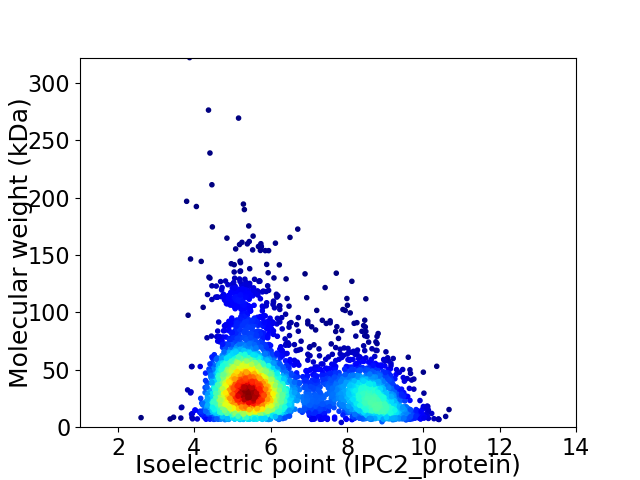
Virtual 2D-PAGE plot for 4341 proteins (isoelectric point calculated using IPC2_protein)
Get csv file with sequences according to given criteria:
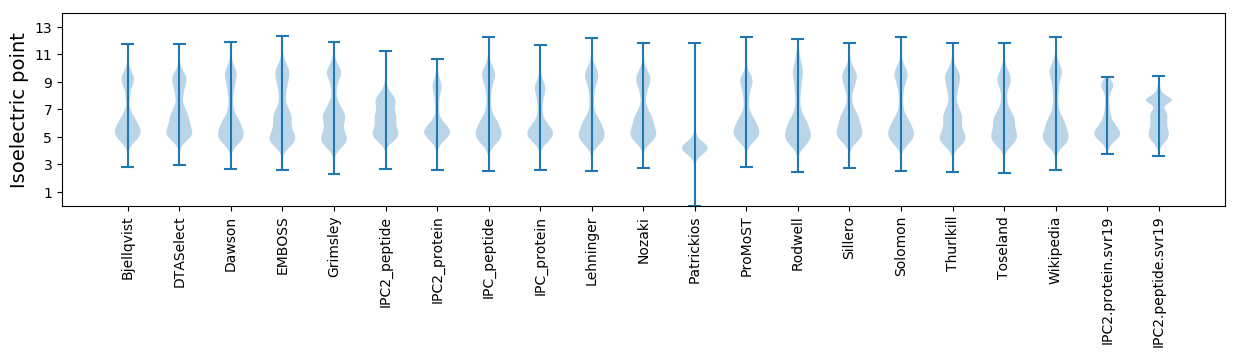
* You can choose from 21 different methods for calculating isoelectric point
Summary statistics related to proteome-wise predictions
Protein with the lowest isoelectric point:
>tr|A0A074LKG2|A0A074LKG2_9BACT Amidohydrolase OS=Anditalea andensis OX=1048983 GN=EL17_09345 PE=4 SV=1
MM1 pKa = 7.48KK2 pKa = 10.42RR3 pKa = 11.84STYY6 pKa = 10.6LKK8 pKa = 10.33ASFGIALSLLVFTSCDD24 pKa = 3.48DD25 pKa = 3.89TLDD28 pKa = 4.1GPQAIADD35 pKa = 3.93FTYY38 pKa = 10.64EE39 pKa = 4.46ADD41 pKa = 4.17PNDD44 pKa = 3.82DD45 pKa = 3.51MTIHH49 pKa = 6.1FTNTSQHH56 pKa = 5.3HH57 pKa = 6.36HH58 pKa = 5.37SSYY61 pKa = 10.7WLFGDD66 pKa = 4.62GSDD69 pKa = 4.82HH70 pKa = 7.38SSEE73 pKa = 4.91DD74 pKa = 3.87SPTHH78 pKa = 5.7TFPAGGIYY86 pKa = 9.17EE87 pKa = 4.27VKK89 pKa = 10.13LAVMGNGTGNEE100 pKa = 3.84IVRR103 pKa = 11.84EE104 pKa = 3.85VSVIDD109 pKa = 3.8RR110 pKa = 11.84SLLGEE115 pKa = 5.01RR116 pKa = 11.84IQDD119 pKa = 3.59GNFEE123 pKa = 4.55NPEE126 pKa = 3.75NWNVYY131 pKa = 9.87AGGSVEE137 pKa = 4.32VTQHH141 pKa = 5.92AFEE144 pKa = 4.71NGQLILSNGEE154 pKa = 3.94EE155 pKa = 4.18VEE157 pKa = 4.63SNVVVWQAIEE167 pKa = 4.03VQANTDD173 pKa = 3.81YY174 pKa = 11.4VFSAQISGGGMHH186 pKa = 6.01QSWVEE191 pKa = 3.6FLFGDD196 pKa = 4.92DD197 pKa = 4.75EE198 pKa = 4.71PEE200 pKa = 4.09EE201 pKa = 5.48DD202 pKa = 6.02DD203 pKa = 6.28DD204 pKa = 6.12YY205 pKa = 11.96SDD207 pKa = 4.68NNQFSMNTWAEE218 pKa = 4.01CGIDD222 pKa = 3.59PFEE225 pKa = 4.7GNIVEE230 pKa = 4.11IHH232 pKa = 6.28CAGDD236 pKa = 3.64GEE238 pKa = 4.69TDD240 pKa = 4.03GIVNFEE246 pKa = 4.24EE247 pKa = 5.73GGTKK251 pKa = 10.23YY252 pKa = 10.2FAIKK256 pKa = 9.95AGSWEE261 pKa = 4.26GTLGPNGVTISNVSLIPADD280 pKa = 3.77EE281 pKa = 4.08LL282 pKa = 3.92
MM1 pKa = 7.48KK2 pKa = 10.42RR3 pKa = 11.84STYY6 pKa = 10.6LKK8 pKa = 10.33ASFGIALSLLVFTSCDD24 pKa = 3.48DD25 pKa = 3.89TLDD28 pKa = 4.1GPQAIADD35 pKa = 3.93FTYY38 pKa = 10.64EE39 pKa = 4.46ADD41 pKa = 4.17PNDD44 pKa = 3.82DD45 pKa = 3.51MTIHH49 pKa = 6.1FTNTSQHH56 pKa = 5.3HH57 pKa = 6.36HH58 pKa = 5.37SSYY61 pKa = 10.7WLFGDD66 pKa = 4.62GSDD69 pKa = 4.82HH70 pKa = 7.38SSEE73 pKa = 4.91DD74 pKa = 3.87SPTHH78 pKa = 5.7TFPAGGIYY86 pKa = 9.17EE87 pKa = 4.27VKK89 pKa = 10.13LAVMGNGTGNEE100 pKa = 3.84IVRR103 pKa = 11.84EE104 pKa = 3.85VSVIDD109 pKa = 3.8RR110 pKa = 11.84SLLGEE115 pKa = 5.01RR116 pKa = 11.84IQDD119 pKa = 3.59GNFEE123 pKa = 4.55NPEE126 pKa = 3.75NWNVYY131 pKa = 9.87AGGSVEE137 pKa = 4.32VTQHH141 pKa = 5.92AFEE144 pKa = 4.71NGQLILSNGEE154 pKa = 3.94EE155 pKa = 4.18VEE157 pKa = 4.63SNVVVWQAIEE167 pKa = 4.03VQANTDD173 pKa = 3.81YY174 pKa = 11.4VFSAQISGGGMHH186 pKa = 6.01QSWVEE191 pKa = 3.6FLFGDD196 pKa = 4.92DD197 pKa = 4.75EE198 pKa = 4.71PEE200 pKa = 4.09EE201 pKa = 5.48DD202 pKa = 6.02DD203 pKa = 6.28DD204 pKa = 6.12YY205 pKa = 11.96SDD207 pKa = 4.68NNQFSMNTWAEE218 pKa = 4.01CGIDD222 pKa = 3.59PFEE225 pKa = 4.7GNIVEE230 pKa = 4.11IHH232 pKa = 6.28CAGDD236 pKa = 3.64GEE238 pKa = 4.69TDD240 pKa = 4.03GIVNFEE246 pKa = 4.24EE247 pKa = 5.73GGTKK251 pKa = 10.23YY252 pKa = 10.2FAIKK256 pKa = 9.95AGSWEE261 pKa = 4.26GTLGPNGVTISNVSLIPADD280 pKa = 3.77EE281 pKa = 4.08LL282 pKa = 3.92
Molecular weight: 30.77 kDa
Isoelectric point according different methods:
Protein with the highest isoelectric point:
>tr|A0A074KVW1|A0A074KVW1_9BACT Histidine kinase OS=Anditalea andensis OX=1048983 GN=EL17_16810 PE=4 SV=1
MM1 pKa = 7.65KK2 pKa = 10.06NGKK5 pKa = 7.78WASDD9 pKa = 3.32YY10 pKa = 10.74HH11 pKa = 6.24RR12 pKa = 11.84HH13 pKa = 6.3NIINNIRR20 pKa = 11.84ACQHH24 pKa = 5.25FTRR27 pKa = 11.84MHH29 pKa = 5.63YY30 pKa = 9.81AWFYY34 pKa = 10.14RR35 pKa = 11.84GRR37 pKa = 11.84SSGSPDD43 pKa = 3.48FRR45 pKa = 11.84WPSHH49 pKa = 4.51TQRR52 pKa = 11.84CTVALFYY59 pKa = 11.19LKK61 pKa = 10.24FFAGLQQRR69 pKa = 11.84GLLRR73 pKa = 11.84FFTGFPFKK81 pKa = 11.17AMASDD86 pKa = 4.52ASPPMM91 pKa = 4.48
MM1 pKa = 7.65KK2 pKa = 10.06NGKK5 pKa = 7.78WASDD9 pKa = 3.32YY10 pKa = 10.74HH11 pKa = 6.24RR12 pKa = 11.84HH13 pKa = 6.3NIINNIRR20 pKa = 11.84ACQHH24 pKa = 5.25FTRR27 pKa = 11.84MHH29 pKa = 5.63YY30 pKa = 9.81AWFYY34 pKa = 10.14RR35 pKa = 11.84GRR37 pKa = 11.84SSGSPDD43 pKa = 3.48FRR45 pKa = 11.84WPSHH49 pKa = 4.51TQRR52 pKa = 11.84CTVALFYY59 pKa = 11.19LKK61 pKa = 10.24FFAGLQQRR69 pKa = 11.84GLLRR73 pKa = 11.84FFTGFPFKK81 pKa = 11.17AMASDD86 pKa = 4.52ASPPMM91 pKa = 4.48
Molecular weight: 10.77 kDa
Isoelectric point according different methods:
Peptides (in silico digests for buttom-up proteomics)
Below you can find in silico digests of the whole proteome with Trypsin, Chymotrypsin, Trypsin+LysC, LysN, ArgC proteases suitable for different mass spec machines.| Try ESI |
 |
|---|
| ChTry ESI |
|
|---|
| ArgC ESI |
|
|---|
| LysN ESI |
|
|---|
| TryLysC ESI |
|
|---|
| Try MALDI |
|
|---|
| ChTry MALDI |
|
|---|
| ArgC MALDI |
|
|---|
| LysN MALDI |
|
|---|
| TryLysC MALDI |
|
|---|
| Try LTQ |
|
|---|
| ChTry LTQ |
|
|---|
| ArgC LTQ |
|
|---|
| LysN LTQ |
|
|---|
| TryLysC LTQ |
|
|---|
| Try MSlow |
|
|---|
| ChTry MSlow |
|
|---|
| ArgC MSlow |
|
|---|
| LysN MSlow |
|
|---|
| TryLysC MSlow |
|
|---|
| Try MShigh |
|
|---|
| ChTry MShigh |
|
|---|
| ArgC MShigh |
|
|---|
| LysN MShigh |
|
|---|
| TryLysC MShigh |
|
|---|
General Statistics
Number of major isoforms |
Number of additional isoforms |
Number of all proteins |
Number of amino acids |
Min. Seq. Length |
Max. Seq. Length |
Avg. Seq. Length |
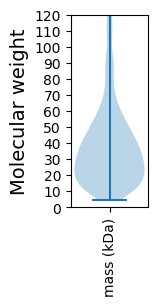
Avg. Mol. Weight |
|---|---|---|---|---|---|---|---|
0 |
1527423 |
39 |
2987 |
351.9 |
39.72 |
Amino acid frequency
Ala |
Cys |
Asp |
Glu |
Phe |
Gly |
His |
Ile |
Lys |
Leu |
|---|---|---|---|---|---|---|---|---|---|
6.536 ± 0.034 | 0.66 ± 0.011 |
5.576 ± 0.024 | 6.568 ± 0.03 |
5.101 ± 0.025 | 6.993 ± 0.035 |
2.097 ± 0.02 | 7.802 ± 0.031 |
6.433 ± 0.05 | 9.53 ± 0.038 |
Met |
Asn |
Gln |
Pro |
Arg |
Ser |
Thr |
Val |
Trp |
Tyr |
|---|---|---|---|---|---|---|---|---|---|
2.543 ± 0.016 | 5.496 ± 0.031 |
3.863 ± 0.022 | 3.597 ± 0.021 |
4.229 ± 0.027 | 6.397 ± 0.025 |
5.2 ± 0.025 | 6.04 ± 0.028 |
1.221 ± 0.013 | 4.118 ± 0.023 |
Most of the basic statistics you can see at this page can be downloaded from this CSV file
See this proteome in:

Proteome-pI is available under Creative Commons Attribution-NoDerivs license, for more details see here
| Reference: Kozlowski LP. Proteome-pI 2.0: Proteome Isoelectric Point Database Update. Nucleic Acids Res. 2021, doi: 10.1093/nar/gkab944 | Contact: Lukasz P. Kozlowski |