Curtobacterium sp. Leaf261
Taxonomy: cellular organisms; Bacteria; Terrabacteria group; Actinobacteria; Actinomycetia; Micrococcales; Microbacteriaceae; Curtobacterium; unclassified Curtobacterium
Average proteome isoelectric point is 6.1
Get precalculated fractions of proteins
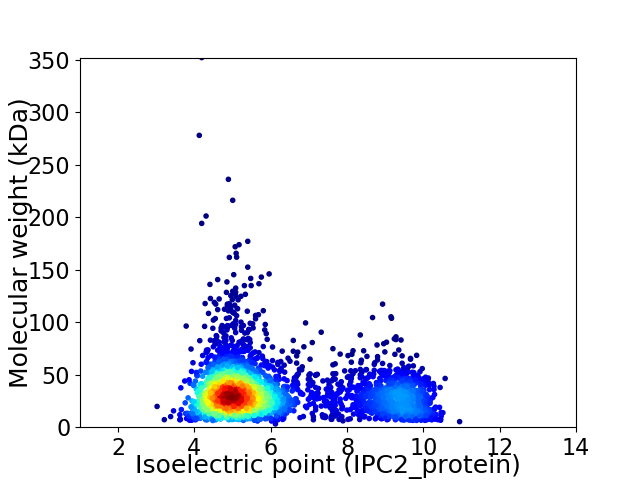
Virtual 2D-PAGE plot for 3343 proteins (isoelectric point calculated using IPC2_protein)
Get csv file with sequences according to given criteria:
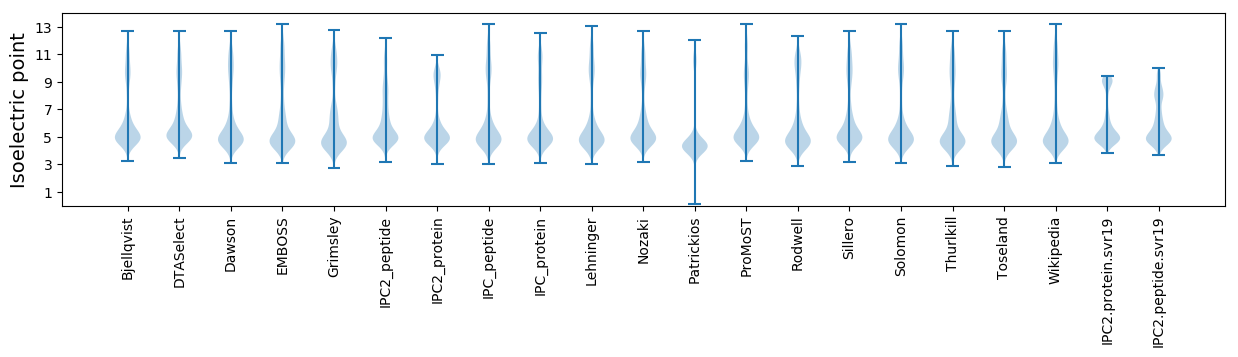
* You can choose from 21 different methods for calculating isoelectric point
Summary statistics related to proteome-wise predictions
Protein with the lowest isoelectric point:
>tr|A0A0Q4UMZ8|A0A0Q4UMZ8_9MICO Alanine dehydrogenase OS=Curtobacterium sp. Leaf261 OX=1736311 GN=ASF23_12690 PE=3 SV=1
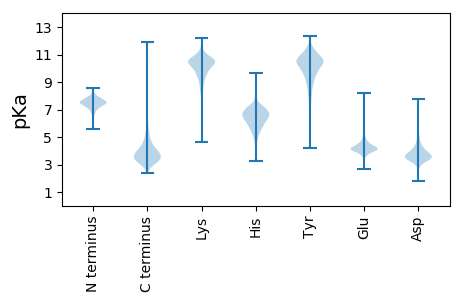
MM1 pKa = 7.07STDD4 pKa = 2.96TTLLVTGMTCEE15 pKa = 3.96HH16 pKa = 6.82CVMSVTEE23 pKa = 4.28EE24 pKa = 4.06LSDD27 pKa = 3.7VAGVDD32 pKa = 3.66AVAVDD37 pKa = 4.49LVDD40 pKa = 4.54GGTSTVTVSASTPLDD55 pKa = 4.09DD56 pKa = 5.47DD57 pKa = 4.13ALRR60 pKa = 11.84AAIEE64 pKa = 4.11EE65 pKa = 4.13AGYY68 pKa = 8.77TPVARR73 pKa = 4.73
MM1 pKa = 7.07STDD4 pKa = 2.96TTLLVTGMTCEE15 pKa = 3.96HH16 pKa = 6.82CVMSVTEE23 pKa = 4.28EE24 pKa = 4.06LSDD27 pKa = 3.7VAGVDD32 pKa = 3.66AVAVDD37 pKa = 4.49LVDD40 pKa = 4.54GGTSTVTVSASTPLDD55 pKa = 4.09DD56 pKa = 5.47DD57 pKa = 4.13ALRR60 pKa = 11.84AAIEE64 pKa = 4.11EE65 pKa = 4.13AGYY68 pKa = 8.77TPVARR73 pKa = 4.73
Molecular weight: 7.43 kDa
Isoelectric point according different methods:
Protein with the highest isoelectric point:
>tr|A0A0Q4VBB7|A0A0Q4VBB7_9MICO DNA helicase OS=Curtobacterium sp. Leaf261 OX=1736311 GN=ASF23_03425 PE=4 SV=1
MM1 pKa = 7.69SKK3 pKa = 9.0RR4 pKa = 11.84TFQPNNRR11 pKa = 11.84RR12 pKa = 11.84RR13 pKa = 11.84AKK15 pKa = 9.97KK16 pKa = 9.33HH17 pKa = 4.25GFRR20 pKa = 11.84LRR22 pKa = 11.84MRR24 pKa = 11.84TRR26 pKa = 11.84AGRR29 pKa = 11.84SILAARR35 pKa = 11.84RR36 pKa = 11.84AKK38 pKa = 10.52GRR40 pKa = 11.84TEE42 pKa = 4.14LSAA45 pKa = 4.86
MM1 pKa = 7.69SKK3 pKa = 9.0RR4 pKa = 11.84TFQPNNRR11 pKa = 11.84RR12 pKa = 11.84RR13 pKa = 11.84AKK15 pKa = 9.97KK16 pKa = 9.33HH17 pKa = 4.25GFRR20 pKa = 11.84LRR22 pKa = 11.84MRR24 pKa = 11.84TRR26 pKa = 11.84AGRR29 pKa = 11.84SILAARR35 pKa = 11.84RR36 pKa = 11.84AKK38 pKa = 10.52GRR40 pKa = 11.84TEE42 pKa = 4.14LSAA45 pKa = 4.86
Molecular weight: 5.3 kDa
Isoelectric point according different methods:
Peptides (in silico digests for buttom-up proteomics)
Below you can find in silico digests of the whole proteome with Trypsin, Chymotrypsin, Trypsin+LysC, LysN, ArgC proteases suitable for different mass spec machines.| Try ESI |
 |
|---|
| ChTry ESI |
|
|---|
| ArgC ESI |
|
|---|
| LysN ESI |
|
|---|
| TryLysC ESI |
|
|---|
| Try MALDI |
|
|---|
| ChTry MALDI |
|
|---|
| ArgC MALDI |
|
|---|
| LysN MALDI |
|
|---|
| TryLysC MALDI |
|
|---|
| Try LTQ |
|
|---|
| ChTry LTQ |
|
|---|
| ArgC LTQ |
|
|---|
| LysN LTQ |
|
|---|
| TryLysC LTQ |
|
|---|
| Try MSlow |
|
|---|
| ChTry MSlow |
|
|---|
| ArgC MSlow |
|
|---|
| LysN MSlow |
|
|---|
| TryLysC MSlow |
|
|---|
| Try MShigh |
|
|---|
| ChTry MShigh |
|
|---|
| ArgC MShigh |
|
|---|
| LysN MShigh |
|
|---|
| TryLysC MShigh |
|
|---|
General Statistics
Number of major isoforms |
Number of additional isoforms |
Number of all proteins |
Number of amino acids |
Min. Seq. Length |
Max. Seq. Length |
Avg. Seq. Length |
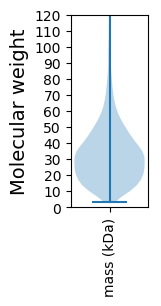
Avg. Mol. Weight |
|---|---|---|---|---|---|---|---|
0 |
1097335 |
29 |
3663 |
328.2 |
34.88 |
Amino acid frequency
Ala |
Cys |
Asp |
Glu |
Phe |
Gly |
His |
Ile |
Lys |
Leu |
|---|---|---|---|---|---|---|---|---|---|
13.398 ± 0.058 | 0.448 ± 0.01 |
6.666 ± 0.043 | 4.857 ± 0.045 |
3.029 ± 0.028 | 9.281 ± 0.043 |
2.023 ± 0.022 | 4.159 ± 0.029 |
1.813 ± 0.035 | 9.415 ± 0.049 |
Met |
Asn |
Gln |
Pro |
Arg |
Ser |
Thr |
Val |
Trp |
Tyr |
|---|---|---|---|---|---|---|---|---|---|
1.746 ± 0.015 | 1.879 ± 0.025 |
5.403 ± 0.031 | 2.77 ± 0.026 |
7.276 ± 0.053 | 5.95 ± 0.04 |
6.914 ± 0.068 | 9.673 ± 0.052 |
1.463 ± 0.018 | 1.835 ± 0.022 |
Most of the basic statistics you can see at this page can be downloaded from this CSV file
See this proteome in:

Proteome-pI is available under Creative Commons Attribution-NoDerivs license, for more details see here
| Reference: Kozlowski LP. Proteome-pI 2.0: Proteome Isoelectric Point Database Update. Nucleic Acids Res. 2021, doi: 10.1093/nar/gkab944 | Contact: Lukasz P. Kozlowski |