Pseudomonas phage vB_PaeP_130_113
Taxonomy: Viruses; Duplodnaviria; Heunggongvirae; Uroviricota; Caudoviricetes; Caudovirales; Autographiviridae; Krylovirinae; Phikmvvirus; Pseudomonas virus 130-113
Average proteome isoelectric point is 6.62
Get precalculated fractions of proteins
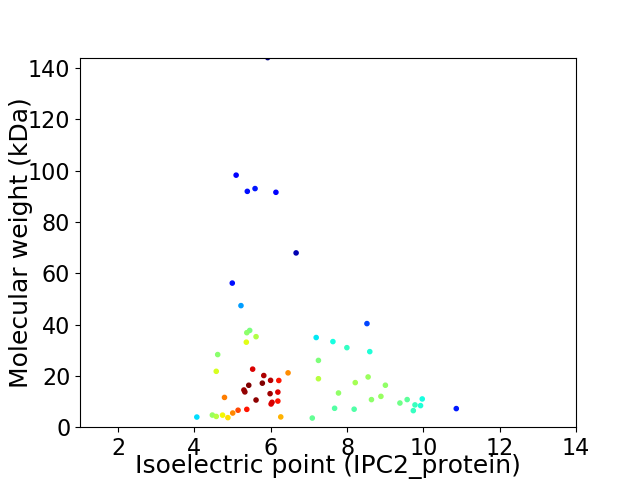
Virtual 2D-PAGE plot for 62 proteins (isoelectric point calculated using IPC2_protein)
Get csv file with sequences according to given criteria:
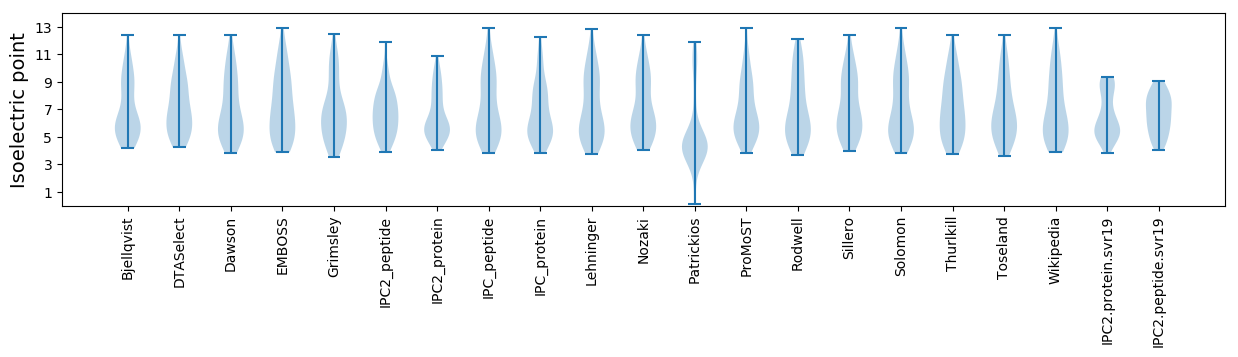
* You can choose from 21 different methods for calculating isoelectric point
Summary statistics related to proteome-wise predictions
Protein with the lowest isoelectric point:
>tr|A0A2R4P9G0|A0A2R4P9G0_9CAUD Uncharacterized protein OS=Pseudomonas phage vB_PaeP_130_113 OX=2161784 GN=C5022_000059 PE=4 SV=1
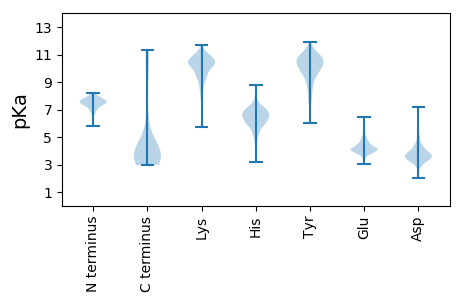
MM1 pKa = 7.32LCEE4 pKa = 4.98HH5 pKa = 7.13PLIDD9 pKa = 3.9PTTQAGLIRR18 pKa = 11.84AVAAYY23 pKa = 10.08QDD25 pKa = 5.01ALDD28 pKa = 4.47LCNALNQGDD37 pKa = 3.63
MM1 pKa = 7.32LCEE4 pKa = 4.98HH5 pKa = 7.13PLIDD9 pKa = 3.9PTTQAGLIRR18 pKa = 11.84AVAAYY23 pKa = 10.08QDD25 pKa = 5.01ALDD28 pKa = 4.47LCNALNQGDD37 pKa = 3.63
Molecular weight: 3.96 kDa
Isoelectric point according different methods:
Protein with the highest isoelectric point:
>tr|A0A2R4P9B8|A0A2R4P9B8_9CAUD Uncharacterized protein OS=Pseudomonas phage vB_PaeP_130_113 OX=2161784 GN=C5022_000020 PE=4 SV=1
MM1 pKa = 6.95TWLIIAVSPSGGCAFVWSRR20 pKa = 11.84KK21 pKa = 9.46RR22 pKa = 11.84PVRR25 pKa = 11.84PLRR28 pKa = 11.84FYY30 pKa = 11.01SRR32 pKa = 11.84KK33 pKa = 9.12AAKK36 pKa = 9.51RR37 pKa = 11.84WLRR40 pKa = 11.84KK41 pKa = 9.23HH42 pKa = 6.11RR43 pKa = 11.84RR44 pKa = 11.84AALLGSRR51 pKa = 11.84FLIVNWSKK59 pKa = 11.19RR60 pKa = 11.84II61 pKa = 3.62
MM1 pKa = 6.95TWLIIAVSPSGGCAFVWSRR20 pKa = 11.84KK21 pKa = 9.46RR22 pKa = 11.84PVRR25 pKa = 11.84PLRR28 pKa = 11.84FYY30 pKa = 11.01SRR32 pKa = 11.84KK33 pKa = 9.12AAKK36 pKa = 9.51RR37 pKa = 11.84WLRR40 pKa = 11.84KK41 pKa = 9.23HH42 pKa = 6.11RR43 pKa = 11.84RR44 pKa = 11.84AALLGSRR51 pKa = 11.84FLIVNWSKK59 pKa = 11.19RR60 pKa = 11.84II61 pKa = 3.62
Molecular weight: 7.25 kDa
Isoelectric point according different methods:
Peptides (in silico digests for buttom-up proteomics)
Below you can find in silico digests of the whole proteome with Trypsin, Chymotrypsin, Trypsin+LysC, LysN, ArgC proteases suitable for different mass spec machines.| Try ESI |
 |
|---|
| ChTry ESI |
|
|---|
| ArgC ESI |
|
|---|
| LysN ESI |
|
|---|
| TryLysC ESI |
|
|---|
| Try MALDI |
|
|---|
| ChTry MALDI |
|
|---|
| ArgC MALDI |
|
|---|
| LysN MALDI |
|
|---|
| TryLysC MALDI |
|
|---|
| Try LTQ |
|
|---|
| ChTry LTQ |
|
|---|
| ArgC LTQ |
|
|---|
| LysN LTQ |
|
|---|
| TryLysC LTQ |
|
|---|
| Try MSlow |
|
|---|
| ChTry MSlow |
|
|---|
| ArgC MSlow |
|
|---|
| LysN MSlow |
|
|---|
| TryLysC MSlow |
|
|---|
| Try MShigh |
|
|---|
| ChTry MShigh |
|
|---|
| ArgC MShigh |
|
|---|
| LysN MShigh |
|
|---|
| TryLysC MShigh |
|
|---|
General Statistics
Number of major isoforms |
Number of additional isoforms |
Number of all proteins |
Number of amino acids |
Min. Seq. Length |
Max. Seq. Length |
Avg. Seq. Length |
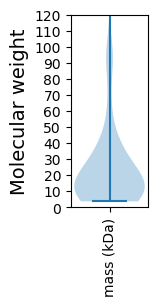
Avg. Mol. Weight |
|---|---|---|---|---|---|---|---|
0 |
14007 |
30 |
1337 |
225.9 |
25.02 |
Amino acid frequency
Ala |
Cys |
Asp |
Glu |
Phe |
Gly |
His |
Ile |
Lys |
Leu |
|---|---|---|---|---|---|---|---|---|---|
11.087 ± 0.487 | 1.107 ± 0.195 |
5.897 ± 0.209 | 5.983 ± 0.232 |
3.248 ± 0.174 | 7.91 ± 0.278 |
2.056 ± 0.161 | 4.219 ± 0.178 |
4.498 ± 0.239 | 9.195 ± 0.259 |
Met |
Asn |
Gln |
Pro |
Arg |
Ser |
Thr |
Val |
Trp |
Tyr |
|---|---|---|---|---|---|---|---|---|---|
2.963 ± 0.117 | 3.555 ± 0.226 |
4.655 ± 0.344 | 4.598 ± 0.311 |
6.939 ± 0.325 | 4.998 ± 0.227 |
5.433 ± 0.251 | 6.839 ± 0.326 |
1.699 ± 0.142 | 3.12 ± 0.23 |
Most of the basic statistics you can see at this page can be downloaded from this CSV file
See this proteome in:

Proteome-pI is available under Creative Commons Attribution-NoDerivs license, for more details see here
| Reference: Kozlowski LP. Proteome-pI 2.0: Proteome Isoelectric Point Database Update. Nucleic Acids Res. 2021, doi: 10.1093/nar/gkab944 | Contact: Lukasz P. Kozlowski |