Epulopiscium sp. SCG-B10WGA-EpuloA2
Taxonomy: cellular organisms; Bacteria; Terrabacteria group; Firmicutes; Clostridia; Eubacteriales; Lachnospiraceae; Epulopiscium; unclassified Epulopiscium
Average proteome isoelectric point is 6.36
Get precalculated fractions of proteins
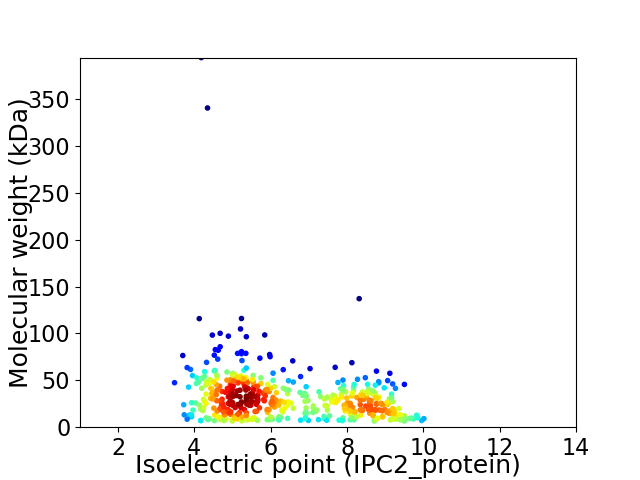
Virtual 2D-PAGE plot for 477 proteins (isoelectric point calculated using IPC2_protein)
Get csv file with sequences according to given criteria:
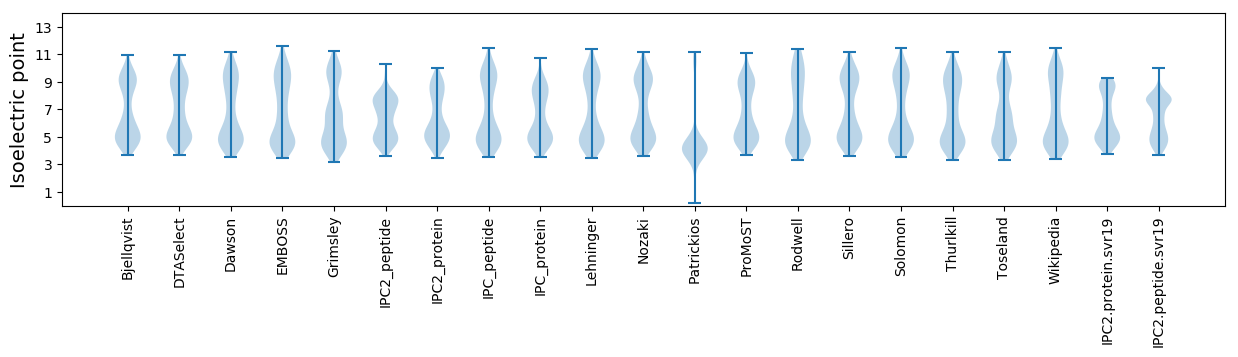
* You can choose from 21 different methods for calculating isoelectric point
Summary statistics related to proteome-wise predictions
Protein with the lowest isoelectric point:
>tr|A0A1V2MBA2|A0A1V2MBA2_9FIRM Uncharacterized protein OS=Epulopiscium sp. SCG-B10WGA-EpuloA2 OX=1712379 GN=AN642_00145 PE=4 SV=1
MM1 pKa = 7.23VFALDD6 pKa = 3.72RR7 pKa = 11.84CSQLYY12 pKa = 10.24ASNIVAVNSYY22 pKa = 11.38ASGFDD27 pKa = 3.13KK28 pKa = 11.15VLIGITCSITVISEE42 pKa = 4.3KK43 pKa = 10.57IGDD46 pKa = 4.02GYY48 pKa = 11.07SINNDD53 pKa = 2.94VAHH56 pKa = 6.91EE57 pKa = 4.28KK58 pKa = 10.14LPSMGYY64 pKa = 9.86IIEE67 pKa = 4.99DD68 pKa = 3.6LANTDD73 pKa = 4.22FSADD77 pKa = 3.47EE78 pKa = 4.67RR79 pKa = 11.84IEE81 pKa = 4.31EE82 pKa = 4.31YY83 pKa = 11.04LEE85 pKa = 4.2QDD87 pKa = 3.75DD88 pKa = 4.2STEE91 pKa = 4.09EE92 pKa = 3.74ITFEE96 pKa = 4.01EE97 pKa = 4.33QTEE100 pKa = 3.83QVYY103 pKa = 10.22ISKK106 pKa = 10.17EE107 pKa = 3.55AATFEE112 pKa = 4.35EE113 pKa = 4.55QTEE116 pKa = 3.84QVYY119 pKa = 10.24ISKK122 pKa = 10.18EE123 pKa = 3.63AVAFEE128 pKa = 4.24EE129 pKa = 4.22QTEE132 pKa = 3.92QVYY135 pKa = 10.24ISKK138 pKa = 10.18EE139 pKa = 3.63AVAFEE144 pKa = 4.24EE145 pKa = 4.22QTEE148 pKa = 3.92QVYY151 pKa = 10.21ISKK154 pKa = 10.2EE155 pKa = 3.92AACEE159 pKa = 3.67EE160 pKa = 4.19EE161 pKa = 4.86MYY163 pKa = 10.92QEE165 pKa = 4.35ILDD168 pKa = 4.35DD169 pKa = 4.16EE170 pKa = 4.67LFKK173 pKa = 10.78EE174 pKa = 4.1IQEE177 pKa = 4.48LIEE180 pKa = 5.0DD181 pKa = 4.31LFEE184 pKa = 4.4EE185 pKa = 4.78KK186 pKa = 10.19PIEE189 pKa = 4.14EE190 pKa = 4.16EE191 pKa = 4.81PILDD195 pKa = 3.79EE196 pKa = 5.62LIIEE200 pKa = 4.63IPDD203 pKa = 3.62LDD205 pKa = 3.66IVLEE209 pKa = 4.18
MM1 pKa = 7.23VFALDD6 pKa = 3.72RR7 pKa = 11.84CSQLYY12 pKa = 10.24ASNIVAVNSYY22 pKa = 11.38ASGFDD27 pKa = 3.13KK28 pKa = 11.15VLIGITCSITVISEE42 pKa = 4.3KK43 pKa = 10.57IGDD46 pKa = 4.02GYY48 pKa = 11.07SINNDD53 pKa = 2.94VAHH56 pKa = 6.91EE57 pKa = 4.28KK58 pKa = 10.14LPSMGYY64 pKa = 9.86IIEE67 pKa = 4.99DD68 pKa = 3.6LANTDD73 pKa = 4.22FSADD77 pKa = 3.47EE78 pKa = 4.67RR79 pKa = 11.84IEE81 pKa = 4.31EE82 pKa = 4.31YY83 pKa = 11.04LEE85 pKa = 4.2QDD87 pKa = 3.75DD88 pKa = 4.2STEE91 pKa = 4.09EE92 pKa = 3.74ITFEE96 pKa = 4.01EE97 pKa = 4.33QTEE100 pKa = 3.83QVYY103 pKa = 10.22ISKK106 pKa = 10.17EE107 pKa = 3.55AATFEE112 pKa = 4.35EE113 pKa = 4.55QTEE116 pKa = 3.84QVYY119 pKa = 10.24ISKK122 pKa = 10.18EE123 pKa = 3.63AVAFEE128 pKa = 4.24EE129 pKa = 4.22QTEE132 pKa = 3.92QVYY135 pKa = 10.24ISKK138 pKa = 10.18EE139 pKa = 3.63AVAFEE144 pKa = 4.24EE145 pKa = 4.22QTEE148 pKa = 3.92QVYY151 pKa = 10.21ISKK154 pKa = 10.2EE155 pKa = 3.92AACEE159 pKa = 3.67EE160 pKa = 4.19EE161 pKa = 4.86MYY163 pKa = 10.92QEE165 pKa = 4.35ILDD168 pKa = 4.35DD169 pKa = 4.16EE170 pKa = 4.67LFKK173 pKa = 10.78EE174 pKa = 4.1IQEE177 pKa = 4.48LIEE180 pKa = 5.0DD181 pKa = 4.31LFEE184 pKa = 4.4EE185 pKa = 4.78KK186 pKa = 10.19PIEE189 pKa = 4.14EE190 pKa = 4.16EE191 pKa = 4.81PILDD195 pKa = 3.79EE196 pKa = 5.62LIIEE200 pKa = 4.63IPDD203 pKa = 3.62LDD205 pKa = 3.66IVLEE209 pKa = 4.18
Molecular weight: 23.97 kDa
Isoelectric point according different methods:
Protein with the highest isoelectric point:
>tr|A0A1V2M9N7|A0A1V2M9N7_9FIRM DNA (cytosine-5-)-methyltransferase OS=Epulopiscium sp. SCG-B10WGA-EpuloA2 OX=1712379 GN=AN642_00265 PE=3 SV=1
MM1 pKa = 7.61AKK3 pKa = 10.41KK4 pKa = 10.4SMKK7 pKa = 10.03VKK9 pKa = 9.22QQRR12 pKa = 11.84PAKK15 pKa = 9.97FSTQAYY21 pKa = 8.08SRR23 pKa = 11.84CRR25 pKa = 11.84ICGRR29 pKa = 11.84PHH31 pKa = 7.05AYY33 pKa = 8.69IRR35 pKa = 11.84KK36 pKa = 8.79FGICRR41 pKa = 11.84VCFRR45 pKa = 11.84EE46 pKa = 4.01LAYY49 pKa = 9.83KK50 pKa = 10.19GQIPGVKK57 pKa = 9.25KK58 pKa = 10.9ASWW61 pKa = 3.03
MM1 pKa = 7.61AKK3 pKa = 10.41KK4 pKa = 10.4SMKK7 pKa = 10.03VKK9 pKa = 9.22QQRR12 pKa = 11.84PAKK15 pKa = 9.97FSTQAYY21 pKa = 8.08SRR23 pKa = 11.84CRR25 pKa = 11.84ICGRR29 pKa = 11.84PHH31 pKa = 7.05AYY33 pKa = 8.69IRR35 pKa = 11.84KK36 pKa = 8.79FGICRR41 pKa = 11.84VCFRR45 pKa = 11.84EE46 pKa = 4.01LAYY49 pKa = 9.83KK50 pKa = 10.19GQIPGVKK57 pKa = 9.25KK58 pKa = 10.9ASWW61 pKa = 3.03
Molecular weight: 7.09 kDa
Isoelectric point according different methods:
Peptides (in silico digests for buttom-up proteomics)
Below you can find in silico digests of the whole proteome with Trypsin, Chymotrypsin, Trypsin+LysC, LysN, ArgC proteases suitable for different mass spec machines.| Try ESI |
 |
|---|
| ChTry ESI |
|
|---|
| ArgC ESI |
|
|---|
| LysN ESI |
|
|---|
| TryLysC ESI |
|
|---|
| Try MALDI |
|
|---|
| ChTry MALDI |
|
|---|
| ArgC MALDI |
|
|---|
| LysN MALDI |
|
|---|
| TryLysC MALDI |
|
|---|
| Try LTQ |
|
|---|
| ChTry LTQ |
|
|---|
| ArgC LTQ |
|
|---|
| LysN LTQ |
|
|---|
| TryLysC LTQ |
|
|---|
| Try MSlow |
|
|---|
| ChTry MSlow |
|
|---|
| ArgC MSlow |
|
|---|
| LysN MSlow |
|
|---|
| TryLysC MSlow |
|
|---|
| Try MShigh |
|
|---|
| ChTry MShigh |
|
|---|
| ArgC MShigh |
|
|---|
| LysN MShigh |
|
|---|
| TryLysC MShigh |
|
|---|
General Statistics
Number of major isoforms |
Number of additional isoforms |
Number of all proteins |
Number of amino acids |
Min. Seq. Length |
Max. Seq. Length |
Avg. Seq. Length |
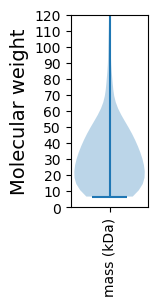
Avg. Mol. Weight |
|---|---|---|---|---|---|---|---|
0 |
138868 |
58 |
3624 |
291.1 |
32.78 |
Amino acid frequency
Ala |
Cys |
Asp |
Glu |
Phe |
Gly |
His |
Ile |
Lys |
Leu |
|---|---|---|---|---|---|---|---|---|---|
6.05 ± 0.147 | 1.1 ± 0.052 |
5.705 ± 0.106 | 7.204 ± 0.121 |
4.475 ± 0.1 | 6.236 ± 0.127 |
1.448 ± 0.058 | 9.923 ± 0.126 |
7.809 ± 0.128 | 8.88 ± 0.134 |
Met |
Asn |
Gln |
Pro |
Arg |
Ser |
Thr |
Val |
Trp |
Tyr |
|---|---|---|---|---|---|---|---|---|---|
2.528 ± 0.075 | 6.33 ± 0.118 |
3.08 ± 0.081 | 3.164 ± 0.082 |
2.997 ± 0.094 | 5.963 ± 0.088 |
5.997 ± 0.189 | 6.256 ± 0.091 |
0.801 ± 0.039 | 4.053 ± 0.094 |
Most of the basic statistics you can see at this page can be downloaded from this CSV file
See this proteome in:

Proteome-pI is available under Creative Commons Attribution-NoDerivs license, for more details see here
| Reference: Kozlowski LP. Proteome-pI 2.0: Proteome Isoelectric Point Database Update. Nucleic Acids Res. 2021, doi: 10.1093/nar/gkab944 | Contact: Lukasz P. Kozlowski |