Paenirhodobacter enshiensis
Taxonomy: cellular organisms; Bacteria; Proteobacteria; Alphaproteobacteria; Rhodobacterales; Rhodobacteraceae; Paenirhodobacter
Average proteome isoelectric point is 6.45
Get precalculated fractions of proteins
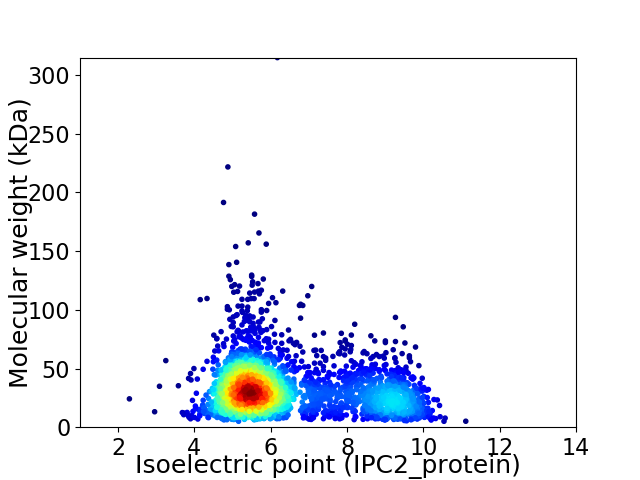
Virtual 2D-PAGE plot for 2781 proteins (isoelectric point calculated using IPC2_protein)
Get csv file with sequences according to given criteria:
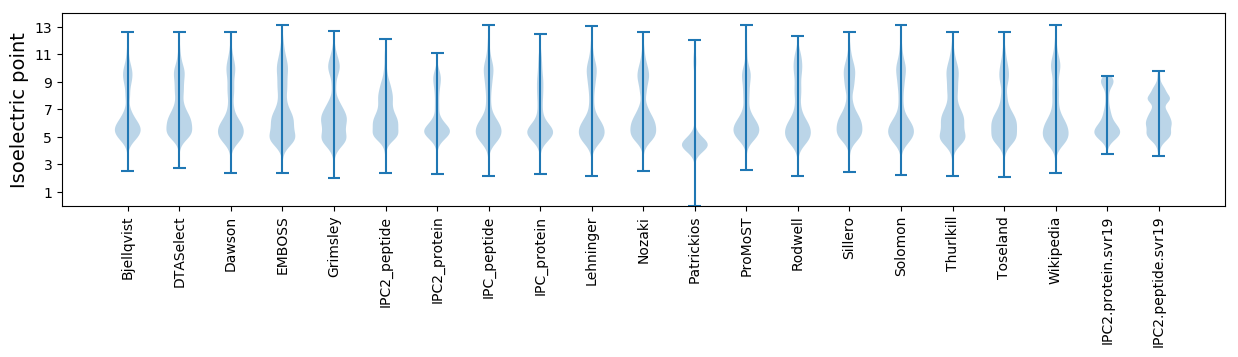
* You can choose from 21 different methods for calculating isoelectric point
Summary statistics related to proteome-wise predictions
Protein with the lowest isoelectric point:
>tr|A0A086XZQ0|A0A086XZQ0_9RHOB Lipopolysaccharide export system permease protein LptF OS=Paenirhodobacter enshiensis OX=1105367 GN=CG50_15935 PE=4 SV=1
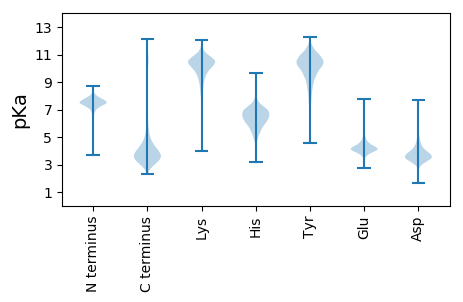
MM1 pKa = 7.5TEE3 pKa = 4.31GAPLIRR9 pKa = 11.84PSTTEE14 pKa = 3.49HH15 pKa = 6.87PLYY18 pKa = 10.96DD19 pKa = 4.01SVADD23 pKa = 3.54ACRR26 pKa = 11.84TVFDD30 pKa = 4.62PEE32 pKa = 4.2IPVNIYY38 pKa = 10.8DD39 pKa = 4.42LGLIYY44 pKa = 10.24TIAISDD50 pKa = 4.07DD51 pKa = 3.67DD52 pKa = 4.04VVNIVMTLTAPGCPVAGDD70 pKa = 3.58MPGWVQNAVEE80 pKa = 4.39SVPGVRR86 pKa = 11.84EE87 pKa = 4.04VNVEE91 pKa = 4.01MTFDD95 pKa = 4.09PQWGMDD101 pKa = 3.61MMSDD105 pKa = 3.68EE106 pKa = 4.89ARR108 pKa = 11.84LEE110 pKa = 4.14LGFMM114 pKa = 4.54
MM1 pKa = 7.5TEE3 pKa = 4.31GAPLIRR9 pKa = 11.84PSTTEE14 pKa = 3.49HH15 pKa = 6.87PLYY18 pKa = 10.96DD19 pKa = 4.01SVADD23 pKa = 3.54ACRR26 pKa = 11.84TVFDD30 pKa = 4.62PEE32 pKa = 4.2IPVNIYY38 pKa = 10.8DD39 pKa = 4.42LGLIYY44 pKa = 10.24TIAISDD50 pKa = 4.07DD51 pKa = 3.67DD52 pKa = 4.04VVNIVMTLTAPGCPVAGDD70 pKa = 3.58MPGWVQNAVEE80 pKa = 4.39SVPGVRR86 pKa = 11.84EE87 pKa = 4.04VNVEE91 pKa = 4.01MTFDD95 pKa = 4.09PQWGMDD101 pKa = 3.61MMSDD105 pKa = 3.68EE106 pKa = 4.89ARR108 pKa = 11.84LEE110 pKa = 4.14LGFMM114 pKa = 4.54
Molecular weight: 12.46 kDa
Isoelectric point according different methods:
Protein with the highest isoelectric point:
>tr|A0A086XQG0|A0A086XQG0_9RHOB DNA repair photolyase OS=Paenirhodobacter enshiensis OX=1105367 GN=CG50_11015 PE=4 SV=1
MM1 pKa = 7.35KK2 pKa = 9.38RR3 pKa = 11.84TYY5 pKa = 10.3QPSQLVRR12 pKa = 11.84ARR14 pKa = 11.84RR15 pKa = 11.84HH16 pKa = 4.38GFRR19 pKa = 11.84ARR21 pKa = 11.84MATKK25 pKa = 10.43GGRR28 pKa = 11.84KK29 pKa = 8.99VLNARR34 pKa = 11.84RR35 pKa = 11.84ARR37 pKa = 11.84GRR39 pKa = 11.84KK40 pKa = 8.97VLSAA44 pKa = 4.11
MM1 pKa = 7.35KK2 pKa = 9.38RR3 pKa = 11.84TYY5 pKa = 10.3QPSQLVRR12 pKa = 11.84ARR14 pKa = 11.84RR15 pKa = 11.84HH16 pKa = 4.38GFRR19 pKa = 11.84ARR21 pKa = 11.84MATKK25 pKa = 10.43GGRR28 pKa = 11.84KK29 pKa = 8.99VLNARR34 pKa = 11.84RR35 pKa = 11.84ARR37 pKa = 11.84GRR39 pKa = 11.84KK40 pKa = 8.97VLSAA44 pKa = 4.11
Molecular weight: 5.09 kDa
Isoelectric point according different methods:
Peptides (in silico digests for buttom-up proteomics)
Below you can find in silico digests of the whole proteome with Trypsin, Chymotrypsin, Trypsin+LysC, LysN, ArgC proteases suitable for different mass spec machines.| Try ESI |
 |
|---|
| ChTry ESI |
|
|---|
| ArgC ESI |
|
|---|
| LysN ESI |
|
|---|
| TryLysC ESI |
|
|---|
| Try MALDI |
|
|---|
| ChTry MALDI |
|
|---|
| ArgC MALDI |
|
|---|
| LysN MALDI |
|
|---|
| TryLysC MALDI |
|
|---|
| Try LTQ |
|
|---|
| ChTry LTQ |
|
|---|
| ArgC LTQ |
|
|---|
| LysN LTQ |
|
|---|
| TryLysC LTQ |
|
|---|
| Try MSlow |
|
|---|
| ChTry MSlow |
|
|---|
| ArgC MSlow |
|
|---|
| LysN MSlow |
|
|---|
| TryLysC MSlow |
|
|---|
| Try MShigh |
|
|---|
| ChTry MShigh |
|
|---|
| ArgC MShigh |
|
|---|
| LysN MShigh |
|
|---|
| TryLysC MShigh |
|
|---|
General Statistics
Number of major isoforms |
Number of additional isoforms |
Number of all proteins |
Number of amino acids |
Min. Seq. Length |
Max. Seq. Length |
Avg. Seq. Length |
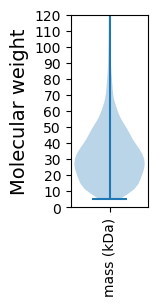
Avg. Mol. Weight |
|---|---|---|---|---|---|---|---|
0 |
881810 |
41 |
2893 |
317.1 |
34.23 |
Amino acid frequency
Ala |
Cys |
Asp |
Glu |
Phe |
Gly |
His |
Ile |
Lys |
Leu |
|---|---|---|---|---|---|---|---|---|---|
13.32 ± 0.072 | 0.846 ± 0.016 |
5.662 ± 0.035 | 5.758 ± 0.042 |
3.569 ± 0.03 | 8.97 ± 0.048 |
1.97 ± 0.022 | 4.995 ± 0.032 |
2.972 ± 0.041 | 10.257 ± 0.053 |
Met |
Asn |
Gln |
Pro |
Arg |
Ser |
Thr |
Val |
Trp |
Tyr |
|---|---|---|---|---|---|---|---|---|---|
2.736 ± 0.024 | 2.224 ± 0.024 |
5.411 ± 0.039 | 2.836 ± 0.022 |
7.321 ± 0.048 | 4.949 ± 0.03 |
5.389 ± 0.03 | 7.34 ± 0.044 |
1.371 ± 0.018 | 2.102 ± 0.021 |
Most of the basic statistics you can see at this page can be downloaded from this CSV file
See this proteome in:

Proteome-pI is available under Creative Commons Attribution-NoDerivs license, for more details see here
| Reference: Kozlowski LP. Proteome-pI 2.0: Proteome Isoelectric Point Database Update. Nucleic Acids Res. 2021, doi: 10.1093/nar/gkab944 | Contact: Lukasz P. Kozlowski |