Saccharothrix sp. CB00851
Taxonomy: cellular organisms; Bacteria; Terrabacteria group; Actinobacteria; Actinomycetia; Pseudonocardiales; Pseudonocardiaceae; Saccharothrix; unclassified Saccharothrix
Average proteome isoelectric point is 6.28
Get precalculated fractions of proteins
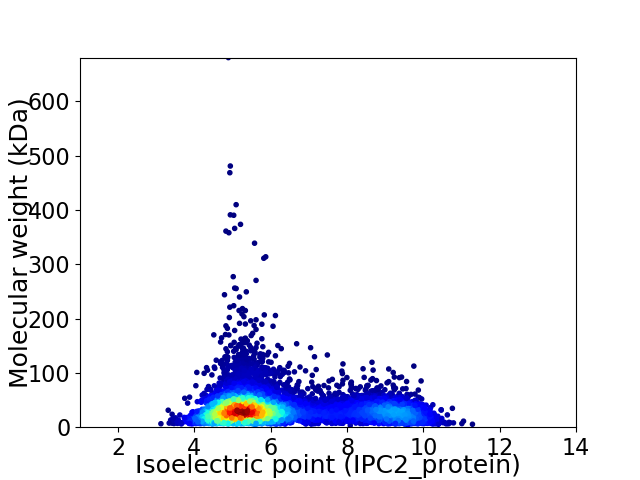
Virtual 2D-PAGE plot for 7942 proteins (isoelectric point calculated using IPC2_protein)
Get csv file with sequences according to given criteria:
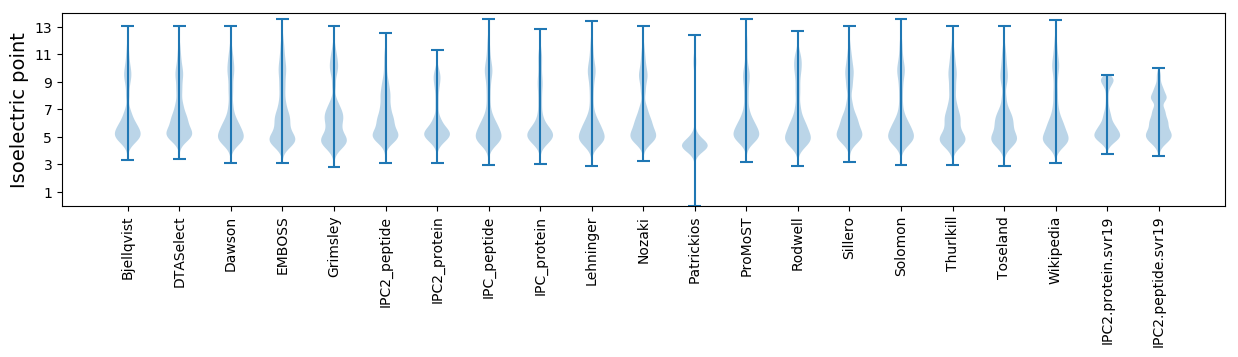
* You can choose from 21 different methods for calculating isoelectric point
Summary statistics related to proteome-wise predictions
Protein with the lowest isoelectric point:
>tr|A0A1Q4Y218|A0A1Q4Y218_9PSEU Uncharacterized protein OS=Saccharothrix sp. CB00851 OX=1835005 GN=A6A25_30955 PE=3 SV=1
MM1 pKa = 8.25DD2 pKa = 5.58PFCLFMVLPLVVIAGILIWGGLAWVGIVVIFCAAIVVVIDD42 pKa = 3.09SWTNRR47 pKa = 11.84PLPFEE52 pKa = 4.82LPEE55 pKa = 5.98DD56 pKa = 4.66DD57 pKa = 5.06YY58 pKa = 11.76DD59 pKa = 4.27YY60 pKa = 11.4DD61 pKa = 3.87PPQTGRR67 pKa = 11.84RR68 pKa = 11.84AYY70 pKa = 10.31
MM1 pKa = 8.25DD2 pKa = 5.58PFCLFMVLPLVVIAGILIWGGLAWVGIVVIFCAAIVVVIDD42 pKa = 3.09SWTNRR47 pKa = 11.84PLPFEE52 pKa = 4.82LPEE55 pKa = 5.98DD56 pKa = 4.66DD57 pKa = 5.06YY58 pKa = 11.76DD59 pKa = 4.27YY60 pKa = 11.4DD61 pKa = 3.87PPQTGRR67 pKa = 11.84RR68 pKa = 11.84AYY70 pKa = 10.31
Molecular weight: 7.87 kDa
Isoelectric point according different methods:
Protein with the highest isoelectric point:
>tr|A0A1Q4X7P5|A0A1Q4X7P5_9PSEU Uncharacterized protein OS=Saccharothrix sp. CB00851 OX=1835005 GN=A6A25_11825 PE=4 SV=1
MM1 pKa = 7.53SKK3 pKa = 10.53GKK5 pKa = 8.66RR6 pKa = 11.84TFQPNNRR13 pKa = 11.84RR14 pKa = 11.84RR15 pKa = 11.84AKK17 pKa = 8.7THH19 pKa = 5.15GFRR22 pKa = 11.84LRR24 pKa = 11.84MRR26 pKa = 11.84TRR28 pKa = 11.84AGRR31 pKa = 11.84AILAARR37 pKa = 11.84RR38 pKa = 11.84GKK40 pKa = 10.25GRR42 pKa = 11.84KK43 pKa = 8.28QLSAA47 pKa = 3.9
MM1 pKa = 7.53SKK3 pKa = 10.53GKK5 pKa = 8.66RR6 pKa = 11.84TFQPNNRR13 pKa = 11.84RR14 pKa = 11.84RR15 pKa = 11.84AKK17 pKa = 8.7THH19 pKa = 5.15GFRR22 pKa = 11.84LRR24 pKa = 11.84MRR26 pKa = 11.84TRR28 pKa = 11.84AGRR31 pKa = 11.84AILAARR37 pKa = 11.84RR38 pKa = 11.84GKK40 pKa = 10.25GRR42 pKa = 11.84KK43 pKa = 8.28QLSAA47 pKa = 3.9
Molecular weight: 5.45 kDa
Isoelectric point according different methods:
Peptides (in silico digests for buttom-up proteomics)
Below you can find in silico digests of the whole proteome with Trypsin, Chymotrypsin, Trypsin+LysC, LysN, ArgC proteases suitable for different mass spec machines.| Try ESI |
 |
|---|
| ChTry ESI |
|
|---|
| ArgC ESI |
|
|---|
| LysN ESI |
|
|---|
| TryLysC ESI |
|
|---|
| Try MALDI |
|
|---|
| ChTry MALDI |
|
|---|
| ArgC MALDI |
|
|---|
| LysN MALDI |
|
|---|
| TryLysC MALDI |
|
|---|
| Try LTQ |
|
|---|
| ChTry LTQ |
|
|---|
| ArgC LTQ |
|
|---|
| LysN LTQ |
|
|---|
| TryLysC LTQ |
|
|---|
| Try MSlow |
|
|---|
| ChTry MSlow |
|
|---|
| ArgC MSlow |
|
|---|
| LysN MSlow |
|
|---|
| TryLysC MSlow |
|
|---|
| Try MShigh |
|
|---|
| ChTry MShigh |
|
|---|
| ArgC MShigh |
|
|---|
| LysN MShigh |
|
|---|
| TryLysC MShigh |
|
|---|
General Statistics
Number of major isoforms |
Number of additional isoforms |
Number of all proteins |
Number of amino acids |
Min. Seq. Length |
Max. Seq. Length |
Avg. Seq. Length |
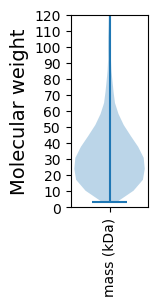
Avg. Mol. Weight |
|---|---|---|---|---|---|---|---|
0 |
2649883 |
33 |
6284 |
333.7 |
35.82 |
Amino acid frequency
Ala |
Cys |
Asp |
Glu |
Phe |
Gly |
His |
Ile |
Lys |
Leu |
|---|---|---|---|---|---|---|---|---|---|
13.141 ± 0.045 | 0.742 ± 0.007 |
6.321 ± 0.023 | 5.505 ± 0.024 |
2.865 ± 0.017 | 9.085 ± 0.028 |
2.342 ± 0.013 | 2.945 ± 0.014 |
1.923 ± 0.02 | 10.48 ± 0.036 |
Met |
Asn |
Gln |
Pro |
Arg |
Ser |
Thr |
Val |
Trp |
Tyr |
|---|---|---|---|---|---|---|---|---|---|
1.564 ± 0.01 | 1.9 ± 0.018 |
5.951 ± 0.02 | 2.634 ± 0.017 |
8.171 ± 0.03 | 4.918 ± 0.017 |
6.178 ± 0.028 | 9.766 ± 0.031 |
1.598 ± 0.011 | 1.971 ± 0.017 |
Most of the basic statistics you can see at this page can be downloaded from this CSV file
See this proteome in:

Proteome-pI is available under Creative Commons Attribution-NoDerivs license, for more details see here
| Reference: Kozlowski LP. Proteome-pI 2.0: Proteome Isoelectric Point Database Update. Nucleic Acids Res. 2021, doi: 10.1093/nar/gkab944 | Contact: Lukasz P. Kozlowski |