Listeria phage P35
Taxonomy: Viruses; Duplodnaviria; Heunggongvirae; Uroviricota; Caudoviricetes; Caudovirales; Siphoviridae; unclassified Siphoviridae
Average proteome isoelectric point is 6.11
Get precalculated fractions of proteins
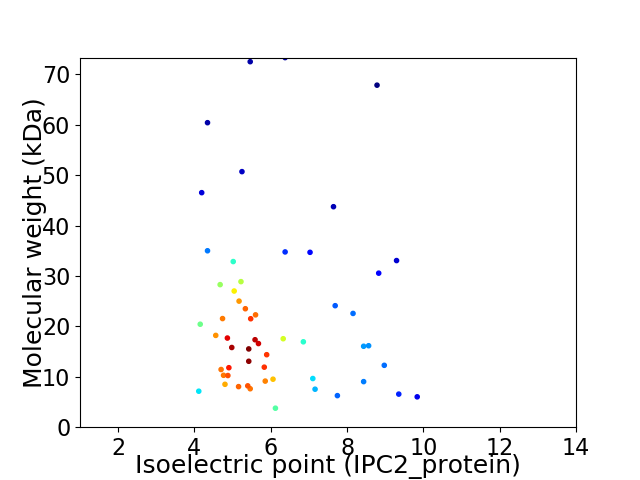
Virtual 2D-PAGE plot for 56 proteins (isoelectric point calculated using IPC2_protein)
Get csv file with sequences according to given criteria:
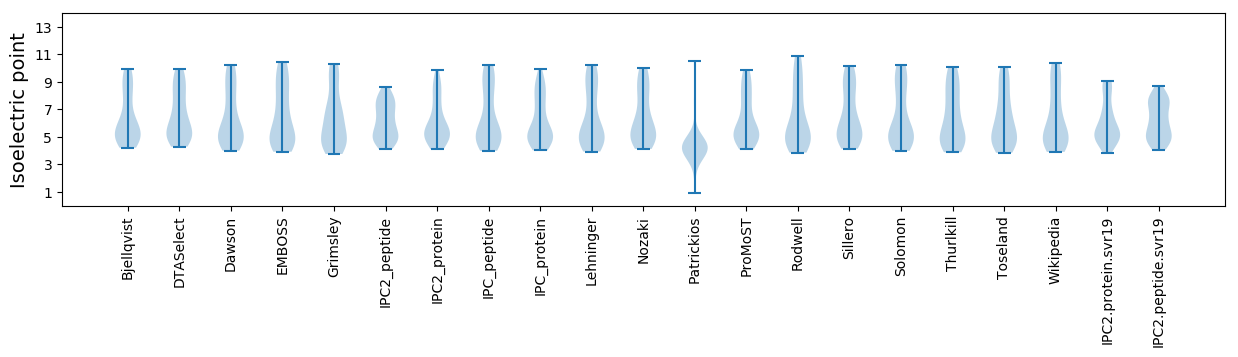
* You can choose from 21 different methods for calculating isoelectric point
Summary statistics related to proteome-wise predictions
Protein with the lowest isoelectric point:
>tr|A8ATT6|A8ATT6_9CAUD Gp48 OS=Listeria phage P35 OX=330398 PE=4 SV=1
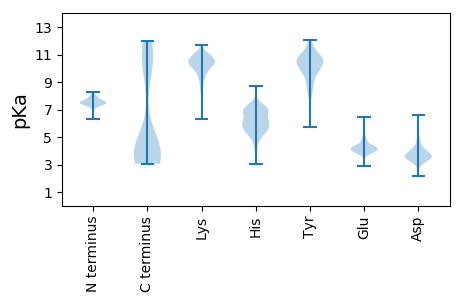
MM1 pKa = 7.92CEE3 pKa = 4.12YY4 pKa = 10.98CNDD7 pKa = 3.84DD8 pKa = 3.61YY9 pKa = 11.3TVRR12 pKa = 11.84SHH14 pKa = 7.39LEE16 pKa = 3.78TPEE19 pKa = 3.78GHH21 pKa = 6.75EE22 pKa = 4.51IEE24 pKa = 4.2IDD26 pKa = 3.52KK27 pKa = 11.3EE28 pKa = 3.98NDD30 pKa = 3.02LSITLDD36 pKa = 3.63LDD38 pKa = 3.17ISEE41 pKa = 4.26DD42 pKa = 4.33FIWIEE47 pKa = 3.71IKK49 pKa = 10.48YY50 pKa = 9.97CPWCGRR56 pKa = 11.84KK57 pKa = 9.72LSDD60 pKa = 3.66
MM1 pKa = 7.92CEE3 pKa = 4.12YY4 pKa = 10.98CNDD7 pKa = 3.84DD8 pKa = 3.61YY9 pKa = 11.3TVRR12 pKa = 11.84SHH14 pKa = 7.39LEE16 pKa = 3.78TPEE19 pKa = 3.78GHH21 pKa = 6.75EE22 pKa = 4.51IEE24 pKa = 4.2IDD26 pKa = 3.52KK27 pKa = 11.3EE28 pKa = 3.98NDD30 pKa = 3.02LSITLDD36 pKa = 3.63LDD38 pKa = 3.17ISEE41 pKa = 4.26DD42 pKa = 4.33FIWIEE47 pKa = 3.71IKK49 pKa = 10.48YY50 pKa = 9.97CPWCGRR56 pKa = 11.84KK57 pKa = 9.72LSDD60 pKa = 3.66
Molecular weight: 7.14 kDa
Isoelectric point according different methods:
Protein with the highest isoelectric point:
>tr|A8ATR1|A8ATR1_9CAUD Gp23 OS=Listeria phage P35 OX=330398 PE=4 SV=1
MM1 pKa = 7.53TKK3 pKa = 9.96TNYY6 pKa = 9.87VLDD9 pKa = 3.52QLTPEE14 pKa = 4.04EE15 pKa = 4.18RR16 pKa = 11.84QLVEE20 pKa = 4.17QSTQLKK26 pKa = 7.99STTVAFWLNLLGSFACDD43 pKa = 4.5FYY45 pKa = 11.0TGRR48 pKa = 11.84ILAGFIKK55 pKa = 10.54VLLSIASSGIGAVIFTIWGLFTYY78 pKa = 10.25RR79 pKa = 11.84SRR81 pKa = 11.84VRR83 pKa = 11.84KK84 pKa = 9.93YY85 pKa = 10.94NNQLLTDD92 pKa = 3.76KK93 pKa = 11.35AFMVNLGKK101 pKa = 8.65PTSKK105 pKa = 10.83GDD107 pKa = 3.47EE108 pKa = 4.18KK109 pKa = 11.54
MM1 pKa = 7.53TKK3 pKa = 9.96TNYY6 pKa = 9.87VLDD9 pKa = 3.52QLTPEE14 pKa = 4.04EE15 pKa = 4.18RR16 pKa = 11.84QLVEE20 pKa = 4.17QSTQLKK26 pKa = 7.99STTVAFWLNLLGSFACDD43 pKa = 4.5FYY45 pKa = 11.0TGRR48 pKa = 11.84ILAGFIKK55 pKa = 10.54VLLSIASSGIGAVIFTIWGLFTYY78 pKa = 10.25RR79 pKa = 11.84SRR81 pKa = 11.84VRR83 pKa = 11.84KK84 pKa = 9.93YY85 pKa = 10.94NNQLLTDD92 pKa = 3.76KK93 pKa = 11.35AFMVNLGKK101 pKa = 8.65PTSKK105 pKa = 10.83GDD107 pKa = 3.47EE108 pKa = 4.18KK109 pKa = 11.54
Molecular weight: 12.28 kDa
Isoelectric point according different methods:
Peptides (in silico digests for buttom-up proteomics)
Below you can find in silico digests of the whole proteome with Trypsin, Chymotrypsin, Trypsin+LysC, LysN, ArgC proteases suitable for different mass spec machines.| Try ESI |
 |
|---|
| ChTry ESI |
|
|---|
| ArgC ESI |
|
|---|
| LysN ESI |
|
|---|
| TryLysC ESI |
|
|---|
| Try MALDI |
|
|---|
| ChTry MALDI |
|
|---|
| ArgC MALDI |
|
|---|
| LysN MALDI |
|
|---|
| TryLysC MALDI |
|
|---|
| Try LTQ |
|
|---|
| ChTry LTQ |
|
|---|
| ArgC LTQ |
|
|---|
| LysN LTQ |
|
|---|
| TryLysC LTQ |
|
|---|
| Try MSlow |
|
|---|
| ChTry MSlow |
|
|---|
| ArgC MSlow |
|
|---|
| LysN MSlow |
|
|---|
| TryLysC MSlow |
|
|---|
| Try MShigh |
|
|---|
| ChTry MShigh |
|
|---|
| ArgC MShigh |
|
|---|
| LysN MShigh |
|
|---|
| TryLysC MShigh |
|
|---|
General Statistics
Number of major isoforms |
Number of additional isoforms |
Number of all proteins |
Number of amino acids |
Min. Seq. Length |
Max. Seq. Length |
Avg. Seq. Length |
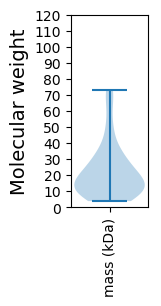
Avg. Mol. Weight |
|---|---|---|---|---|---|---|---|
0 |
10977 |
34 |
635 |
196.0 |
22.35 |
Amino acid frequency
Ala |
Cys |
Asp |
Glu |
Phe |
Gly |
His |
Ile |
Lys |
Leu |
|---|---|---|---|---|---|---|---|---|---|
5.575 ± 0.333 | 0.729 ± 0.112 |
7.288 ± 0.272 | 6.678 ± 0.422 |
4.455 ± 0.226 | 6.158 ± 0.451 |
1.831 ± 0.199 | 6.933 ± 0.259 |
7.762 ± 0.408 | 7.762 ± 0.273 |
Met |
Asn |
Gln |
Pro |
Arg |
Ser |
Thr |
Val |
Trp |
Tyr |
|---|---|---|---|---|---|---|---|---|---|
2.824 ± 0.165 | 5.584 ± 0.277 |
3.434 ± 0.234 | 3.835 ± 0.219 |
4.382 ± 0.282 | 5.484 ± 0.2 |
6.714 ± 0.373 | 7.015 ± 0.224 |
1.248 ± 0.144 | 4.309 ± 0.253 |
Most of the basic statistics you can see at this page can be downloaded from this CSV file
See this proteome in:

Proteome-pI is available under Creative Commons Attribution-NoDerivs license, for more details see here
| Reference: Kozlowski LP. Proteome-pI 2.0: Proteome Isoelectric Point Database Update. Nucleic Acids Res. 2021, doi: 10.1093/nar/gkab944 | Contact: Lukasz P. Kozlowski |