Streptomyces qinglanensis
Taxonomy: cellular organisms; Bacteria; Terrabacteria group; Actinobacteria; Actinomycetia; Streptomycetales; Streptomycetaceae; Streptomyces
Average proteome isoelectric point is 6.47
Get precalculated fractions of proteins
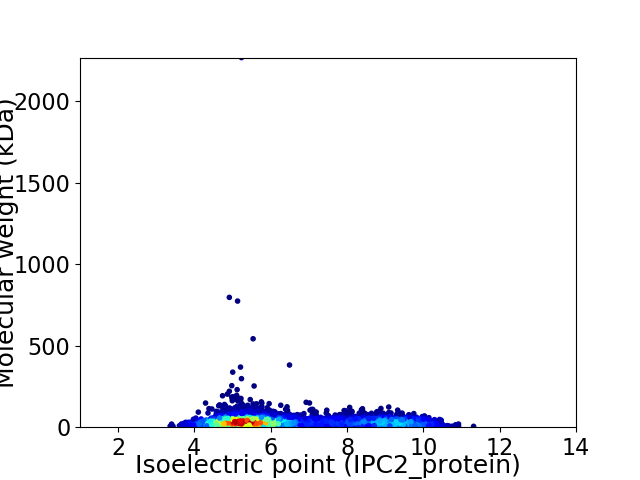
Virtual 2D-PAGE plot for 5156 proteins (isoelectric point calculated using IPC2_protein)
Get csv file with sequences according to given criteria:
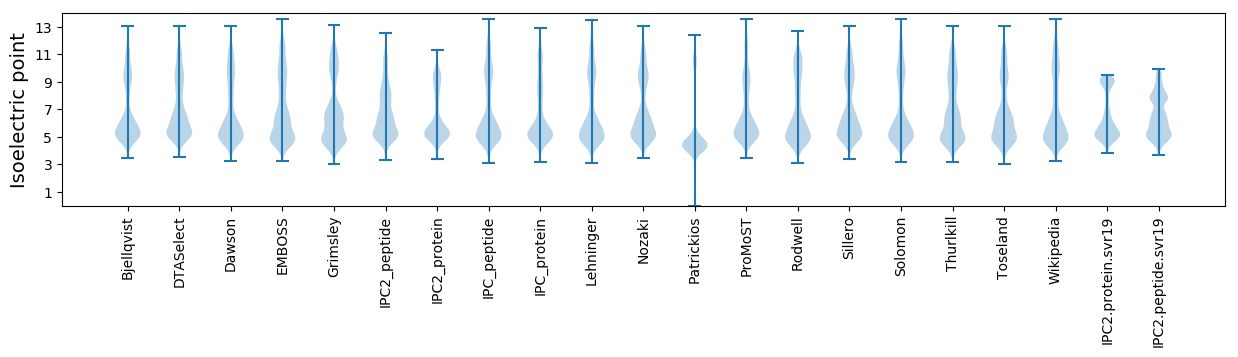
* You can choose from 21 different methods for calculating isoelectric point
Summary statistics related to proteome-wise predictions
Protein with the lowest isoelectric point:
>tr|A0A1E7K3R7|A0A1E7K3R7_9ACTN RNA helicase OS=Streptomyces qinglanensis OX=943816 GN=AN217_12945 PE=4 SV=1
MM1 pKa = 7.67SYY3 pKa = 11.36ANPDD7 pKa = 4.0PDD9 pKa = 4.98PDD11 pKa = 3.83TTTGLEE17 pKa = 4.23PGGEE21 pKa = 4.27VPPGEE26 pKa = 4.26TPPAEE31 pKa = 4.44GSTSEE36 pKa = 4.0SGPFEE41 pKa = 3.99KK42 pKa = 10.62HH43 pKa = 5.41NPATGWSVVPVVLITLVVVAVLLFFVGYY71 pKa = 9.99LVEE74 pKa = 4.22LQQ76 pKa = 3.37
MM1 pKa = 7.67SYY3 pKa = 11.36ANPDD7 pKa = 4.0PDD9 pKa = 4.98PDD11 pKa = 3.83TTTGLEE17 pKa = 4.23PGGEE21 pKa = 4.27VPPGEE26 pKa = 4.26TPPAEE31 pKa = 4.44GSTSEE36 pKa = 4.0SGPFEE41 pKa = 3.99KK42 pKa = 10.62HH43 pKa = 5.41NPATGWSVVPVVLITLVVVAVLLFFVGYY71 pKa = 9.99LVEE74 pKa = 4.22LQQ76 pKa = 3.37
Molecular weight: 7.92 kDa
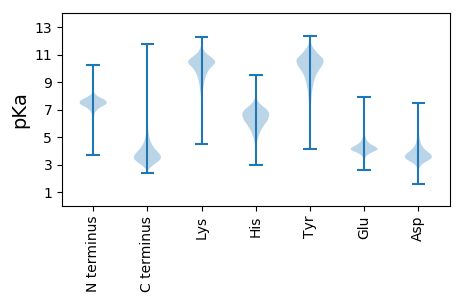
Isoelectric point according different methods:
Protein with the highest isoelectric point:
>tr|A0A1E7KE74|A0A1E7KE74_9ACTN Uncharacterized protein OS=Streptomyces qinglanensis OX=943816 GN=AN217_02945 PE=4 SV=1
MM1 pKa = 7.69SKK3 pKa = 9.0RR4 pKa = 11.84TFQPNNRR11 pKa = 11.84RR12 pKa = 11.84RR13 pKa = 11.84AKK15 pKa = 8.7THH17 pKa = 5.15GFRR20 pKa = 11.84LRR22 pKa = 11.84MRR24 pKa = 11.84TRR26 pKa = 11.84AGRR29 pKa = 11.84AIVANRR35 pKa = 11.84RR36 pKa = 11.84SKK38 pKa = 10.81GRR40 pKa = 11.84ARR42 pKa = 11.84LSAA45 pKa = 3.91
MM1 pKa = 7.69SKK3 pKa = 9.0RR4 pKa = 11.84TFQPNNRR11 pKa = 11.84RR12 pKa = 11.84RR13 pKa = 11.84AKK15 pKa = 8.7THH17 pKa = 5.15GFRR20 pKa = 11.84LRR22 pKa = 11.84MRR24 pKa = 11.84TRR26 pKa = 11.84AGRR29 pKa = 11.84AIVANRR35 pKa = 11.84RR36 pKa = 11.84SKK38 pKa = 10.81GRR40 pKa = 11.84ARR42 pKa = 11.84LSAA45 pKa = 3.91
Molecular weight: 5.3 kDa
Isoelectric point according different methods:
Peptides (in silico digests for buttom-up proteomics)
Below you can find in silico digests of the whole proteome with Trypsin, Chymotrypsin, Trypsin+LysC, LysN, ArgC proteases suitable for different mass spec machines.| Try ESI |
 |
|---|
| ChTry ESI |
|
|---|
| ArgC ESI |
|
|---|
| LysN ESI |
|
|---|
| TryLysC ESI |
|
|---|
| Try MALDI |
|
|---|
| ChTry MALDI |
|
|---|
| ArgC MALDI |
|
|---|
| LysN MALDI |
|
|---|
| TryLysC MALDI |
|
|---|
| Try LTQ |
|
|---|
| ChTry LTQ |
|
|---|
| ArgC LTQ |
|
|---|
| LysN LTQ |
|
|---|
| TryLysC LTQ |
|
|---|
| Try MSlow |
|
|---|
| ChTry MSlow |
|
|---|
| ArgC MSlow |
|
|---|
| LysN MSlow |
|
|---|
| TryLysC MSlow |
|
|---|
| Try MShigh |
|
|---|
| ChTry MShigh |
|
|---|
| ArgC MShigh |
|
|---|
| LysN MShigh |
|
|---|
| TryLysC MShigh |
|
|---|
General Statistics
Number of major isoforms |
Number of additional isoforms |
Number of all proteins |
Number of amino acids |
Min. Seq. Length |
Max. Seq. Length |
Avg. Seq. Length |
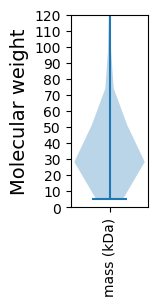
Avg. Mol. Weight |
|---|---|---|---|---|---|---|---|
0 |
1763939 |
45 |
21241 |
342.1 |
36.49 |
Amino acid frequency
Ala |
Cys |
Asp |
Glu |
Phe |
Gly |
His |
Ile |
Lys |
Leu |
|---|---|---|---|---|---|---|---|---|---|
14.112 ± 0.066 | 0.805 ± 0.013 |
5.79 ± 0.027 | 6.101 ± 0.033 |
2.621 ± 0.016 | 9.975 ± 0.04 |
2.319 ± 0.015 | 2.667 ± 0.029 |
1.979 ± 0.034 | 10.425 ± 0.049 |
Met |
Asn |
Gln |
Pro |
Arg |
Ser |
Thr |
Val |
Trp |
Tyr |
|---|---|---|---|---|---|---|---|---|---|
1.671 ± 0.015 | 1.557 ± 0.018 |
6.409 ± 0.044 | 2.767 ± 0.023 |
8.528 ± 0.038 | 4.995 ± 0.028 |
5.752 ± 0.027 | 8.185 ± 0.034 |
1.42 ± 0.015 | 1.922 ± 0.017 |
Most of the basic statistics you can see at this page can be downloaded from this CSV file
See this proteome in:

Proteome-pI is available under Creative Commons Attribution-NoDerivs license, for more details see here
| Reference: Kozlowski LP. Proteome-pI 2.0: Proteome Isoelectric Point Database Update. Nucleic Acids Res. 2021, doi: 10.1093/nar/gkab944 | Contact: Lukasz P. Kozlowski |