Pulveribacter suum
Taxonomy: cellular organisms; Bacteria; Proteobacteria; Betaproteobacteria; Burkholderiales; Comamonadaceae; Pulveribacter
Average proteome isoelectric point is 7.0
Get precalculated fractions of proteins
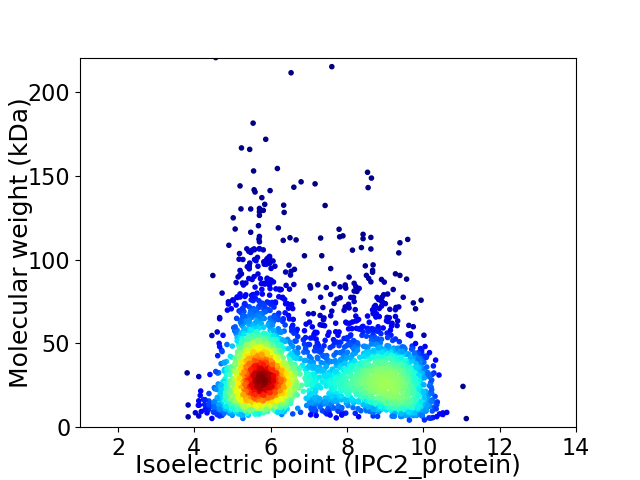
Virtual 2D-PAGE plot for 2968 proteins (isoelectric point calculated using IPC2_protein)
Get csv file with sequences according to given criteria:
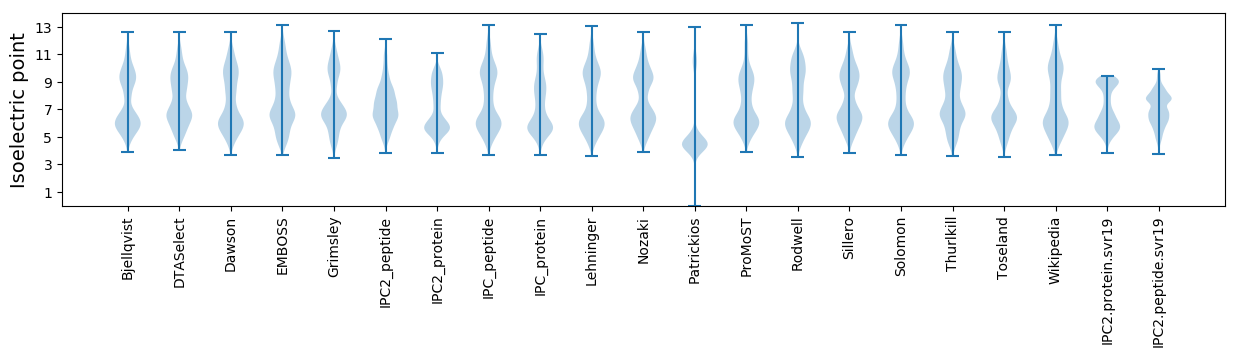
* You can choose from 21 different methods for calculating isoelectric point
Summary statistics related to proteome-wise predictions
Protein with the lowest isoelectric point:
>tr|A0A2P1NJ70|A0A2P1NJ70_9BURK DNA mismatch repair protein MutS OS=Pulveribacter suum OX=2116657 GN=C7H73_05025 PE=4 SV=1
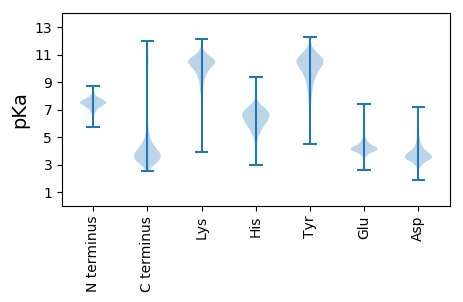
MM1 pKa = 7.74TDD3 pKa = 3.07LTTWMCAVCGWLYY16 pKa = 11.19DD17 pKa = 4.12EE18 pKa = 5.53AAGAPDD24 pKa = 4.0HH25 pKa = 6.6GLAPGTRR32 pKa = 11.84WQDD35 pKa = 3.22VPADD39 pKa = 3.82WTCPEE44 pKa = 4.52CGAGKK49 pKa = 10.03DD50 pKa = 3.34AFEE53 pKa = 4.22MVEE56 pKa = 3.83II57 pKa = 4.8
MM1 pKa = 7.74TDD3 pKa = 3.07LTTWMCAVCGWLYY16 pKa = 11.19DD17 pKa = 4.12EE18 pKa = 5.53AAGAPDD24 pKa = 4.0HH25 pKa = 6.6GLAPGTRR32 pKa = 11.84WQDD35 pKa = 3.22VPADD39 pKa = 3.82WTCPEE44 pKa = 4.52CGAGKK49 pKa = 10.03DD50 pKa = 3.34AFEE53 pKa = 4.22MVEE56 pKa = 3.83II57 pKa = 4.8
Molecular weight: 6.19 kDa
Isoelectric point according different methods:
Protein with the highest isoelectric point:
>tr|A0A2P1NGY3|A0A2P1NGY3_9BURK DNA-directed RNA polymerase subunit alpha OS=Pulveribacter suum OX=2116657 GN=rpoA PE=3 SV=1
MM1 pKa = 7.35KK2 pKa = 9.43RR3 pKa = 11.84TYY5 pKa = 10.25QPSKK9 pKa = 7.79TRR11 pKa = 11.84RR12 pKa = 11.84ARR14 pKa = 11.84THH16 pKa = 5.79GFLVRR21 pKa = 11.84MKK23 pKa = 9.7TRR25 pKa = 11.84GGRR28 pKa = 11.84AVINARR34 pKa = 11.84RR35 pKa = 11.84AKK37 pKa = 9.58GRR39 pKa = 11.84KK40 pKa = 8.75RR41 pKa = 11.84LAVV44 pKa = 3.41
MM1 pKa = 7.35KK2 pKa = 9.43RR3 pKa = 11.84TYY5 pKa = 10.25QPSKK9 pKa = 7.79TRR11 pKa = 11.84RR12 pKa = 11.84ARR14 pKa = 11.84THH16 pKa = 5.79GFLVRR21 pKa = 11.84MKK23 pKa = 9.7TRR25 pKa = 11.84GGRR28 pKa = 11.84AVINARR34 pKa = 11.84RR35 pKa = 11.84AKK37 pKa = 9.58GRR39 pKa = 11.84KK40 pKa = 8.75RR41 pKa = 11.84LAVV44 pKa = 3.41
Molecular weight: 5.14 kDa
Isoelectric point according different methods:
Peptides (in silico digests for buttom-up proteomics)
Below you can find in silico digests of the whole proteome with Trypsin, Chymotrypsin, Trypsin+LysC, LysN, ArgC proteases suitable for different mass spec machines.| Try ESI |
 |
|---|
| ChTry ESI |
|
|---|
| ArgC ESI |
|
|---|
| LysN ESI |
|
|---|
| TryLysC ESI |
|
|---|
| Try MALDI |
|
|---|
| ChTry MALDI |
|
|---|
| ArgC MALDI |
|
|---|
| LysN MALDI |
|
|---|
| TryLysC MALDI |
|
|---|
| Try LTQ |
|
|---|
| ChTry LTQ |
|
|---|
| ArgC LTQ |
|
|---|
| LysN LTQ |
|
|---|
| TryLysC LTQ |
|
|---|
| Try MSlow |
|
|---|
| ChTry MSlow |
|
|---|
| ArgC MSlow |
|
|---|
| LysN MSlow |
|
|---|
| TryLysC MSlow |
|
|---|
| Try MShigh |
|
|---|
| ChTry MShigh |
|
|---|
| ArgC MShigh |
|
|---|
| LysN MShigh |
|
|---|
| TryLysC MShigh |
|
|---|
General Statistics
Number of major isoforms |
Number of additional isoforms |
Number of all proteins |
Number of amino acids |
Min. Seq. Length |
Max. Seq. Length |
Avg. Seq. Length |
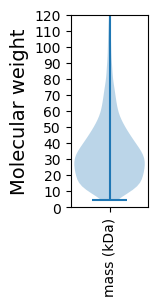
Avg. Mol. Weight |
|---|---|---|---|---|---|---|---|
0 |
1000936 |
37 |
2061 |
337.2 |
36.38 |
Amino acid frequency
Ala |
Cys |
Asp |
Glu |
Phe |
Gly |
His |
Ile |
Lys |
Leu |
|---|---|---|---|---|---|---|---|---|---|
14.238 ± 0.078 | 0.927 ± 0.014 |
4.878 ± 0.029 | 5.154 ± 0.041 |
3.216 ± 0.026 | 8.648 ± 0.041 |
2.367 ± 0.024 | 3.811 ± 0.033 |
2.656 ± 0.04 | 11.192 ± 0.063 |
Met |
Asn |
Gln |
Pro |
Arg |
Ser |
Thr |
Val |
Trp |
Tyr |
|---|---|---|---|---|---|---|---|---|---|
2.355 ± 0.021 | 2.193 ± 0.024 |
5.515 ± 0.034 | 4.729 ± 0.034 |
7.234 ± 0.042 | 4.872 ± 0.03 |
4.834 ± 0.03 | 7.571 ± 0.038 |
1.527 ± 0.016 | 2.081 ± 0.022 |
Most of the basic statistics you can see at this page can be downloaded from this CSV file
See this proteome in:

Proteome-pI is available under Creative Commons Attribution-NoDerivs license, for more details see here
| Reference: Kozlowski LP. Proteome-pI 2.0: Proteome Isoelectric Point Database Update. Nucleic Acids Res. 2021, doi: 10.1093/nar/gkab944 | Contact: Lukasz P. Kozlowski |