Sphingomonadaceae bacterium PASS1
Taxonomy: cellular organisms; Bacteria; Proteobacteria; Alphaproteobacteria; Sphingomonadales; Sphingomonadaceae; unclassified Sphingomonadaceae
Average proteome isoelectric point is 6.36
Get precalculated fractions of proteins
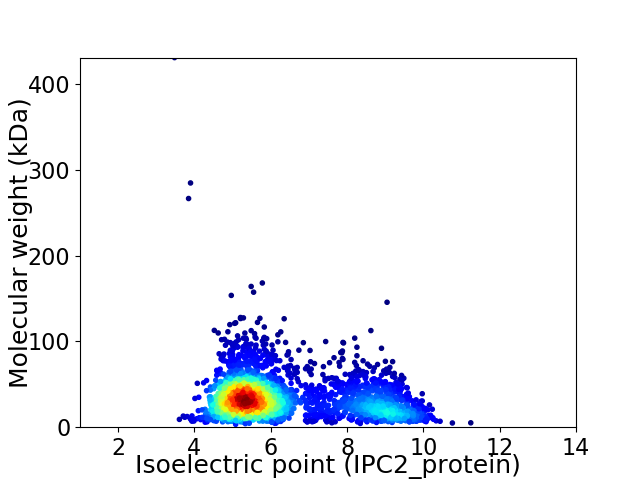
Virtual 2D-PAGE plot for 2834 proteins (isoelectric point calculated using IPC2_protein)
Get csv file with sequences according to given criteria:
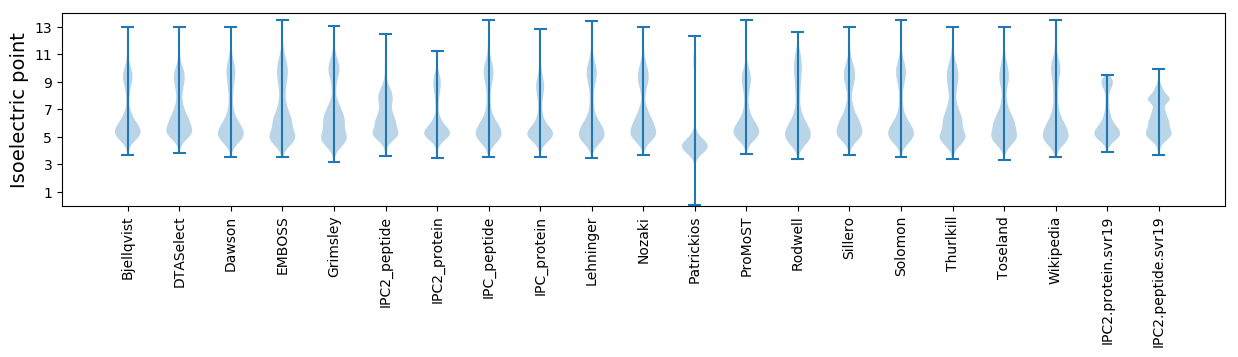
* You can choose from 21 different methods for calculating isoelectric point
Summary statistics related to proteome-wise predictions
Protein with the lowest isoelectric point:
>tr|A0A257DNB8|A0A257DNB8_9SPHN Acyl-CoA dehydrogenase OS=Sphingomonadaceae bacterium PASS1 OX=2015579 GN=CFE36_01800 PE=3 SV=1
MM1 pKa = 7.6HH2 pKa = 6.7EE3 pKa = 3.84TWEE6 pKa = 4.02QAEE9 pKa = 4.06YY10 pKa = 10.39RR11 pKa = 11.84QYY13 pKa = 10.98SCLFCGHH20 pKa = 7.22IYY22 pKa = 10.63DD23 pKa = 4.57EE24 pKa = 4.9EE25 pKa = 5.07EE26 pKa = 4.34GDD28 pKa = 3.99SDD30 pKa = 4.91SGIAPGTRR38 pKa = 11.84WEE40 pKa = 5.39DD41 pKa = 4.29ISDD44 pKa = 3.69DD45 pKa = 4.03WCCPMCSAGKK55 pKa = 10.44ADD57 pKa = 4.48FEE59 pKa = 5.59LII61 pKa = 3.86
MM1 pKa = 7.6HH2 pKa = 6.7EE3 pKa = 3.84TWEE6 pKa = 4.02QAEE9 pKa = 4.06YY10 pKa = 10.39RR11 pKa = 11.84QYY13 pKa = 10.98SCLFCGHH20 pKa = 7.22IYY22 pKa = 10.63DD23 pKa = 4.57EE24 pKa = 4.9EE25 pKa = 5.07EE26 pKa = 4.34GDD28 pKa = 3.99SDD30 pKa = 4.91SGIAPGTRR38 pKa = 11.84WEE40 pKa = 5.39DD41 pKa = 4.29ISDD44 pKa = 3.69DD45 pKa = 4.03WCCPMCSAGKK55 pKa = 10.44ADD57 pKa = 4.48FEE59 pKa = 5.59LII61 pKa = 3.86
Molecular weight: 7.03 kDa
Isoelectric point according different methods:
Protein with the highest isoelectric point:
>tr|A0A257DNJ1|A0A257DNJ1_9SPHN Imidazole glycerol phosphate synthase subunit HisF OS=Sphingomonadaceae bacterium PASS1 OX=2015579 GN=hisF PE=3 SV=1
MM1 pKa = 7.45KK2 pKa = 9.61RR3 pKa = 11.84TFQPSNLVRR12 pKa = 11.84ARR14 pKa = 11.84RR15 pKa = 11.84HH16 pKa = 4.37GFRR19 pKa = 11.84LRR21 pKa = 11.84MSTAAGRR28 pKa = 11.84NILNARR34 pKa = 11.84RR35 pKa = 11.84ARR37 pKa = 11.84GRR39 pKa = 11.84KK40 pKa = 9.02KK41 pKa = 10.61LSAA44 pKa = 4.03
MM1 pKa = 7.45KK2 pKa = 9.61RR3 pKa = 11.84TFQPSNLVRR12 pKa = 11.84ARR14 pKa = 11.84RR15 pKa = 11.84HH16 pKa = 4.37GFRR19 pKa = 11.84LRR21 pKa = 11.84MSTAAGRR28 pKa = 11.84NILNARR34 pKa = 11.84RR35 pKa = 11.84ARR37 pKa = 11.84GRR39 pKa = 11.84KK40 pKa = 9.02KK41 pKa = 10.61LSAA44 pKa = 4.03
Molecular weight: 5.11 kDa
Isoelectric point according different methods:
Peptides (in silico digests for buttom-up proteomics)
Below you can find in silico digests of the whole proteome with Trypsin, Chymotrypsin, Trypsin+LysC, LysN, ArgC proteases suitable for different mass spec machines.| Try ESI |
 |
|---|
| ChTry ESI |
|
|---|
| ArgC ESI |
|
|---|
| LysN ESI |
|
|---|
| TryLysC ESI |
|
|---|
| Try MALDI |
|
|---|
| ChTry MALDI |
|
|---|
| ArgC MALDI |
|
|---|
| LysN MALDI |
|
|---|
| TryLysC MALDI |
|
|---|
| Try LTQ |
|
|---|
| ChTry LTQ |
|
|---|
| ArgC LTQ |
|
|---|
| LysN LTQ |
|
|---|
| TryLysC LTQ |
|
|---|
| Try MSlow |
|
|---|
| ChTry MSlow |
|
|---|
| ArgC MSlow |
|
|---|
| LysN MSlow |
|
|---|
| TryLysC MSlow |
|
|---|
| Try MShigh |
|
|---|
| ChTry MShigh |
|
|---|
| ArgC MShigh |
|
|---|
| LysN MShigh |
|
|---|
| TryLysC MShigh |
|
|---|
General Statistics
Number of major isoforms |
Number of additional isoforms |
Number of all proteins |
Number of amino acids |
Min. Seq. Length |
Max. Seq. Length |
Avg. Seq. Length |
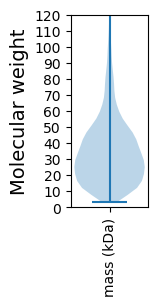
Avg. Mol. Weight |
|---|---|---|---|---|---|---|---|
0 |
930857 |
32 |
4232 |
328.5 |
35.65 |
Amino acid frequency
Ala |
Cys |
Asp |
Glu |
Phe |
Gly |
His |
Ile |
Lys |
Leu |
|---|---|---|---|---|---|---|---|---|---|
12.178 ± 0.055 | 0.863 ± 0.016 |
5.997 ± 0.037 | 5.311 ± 0.045 |
3.844 ± 0.03 | 8.596 ± 0.045 |
2.067 ± 0.025 | 5.707 ± 0.03 |
3.867 ± 0.036 | 9.353 ± 0.05 |
Met |
Asn |
Gln |
Pro |
Arg |
Ser |
Thr |
Val |
Trp |
Tyr |
|---|---|---|---|---|---|---|---|---|---|
2.717 ± 0.022 | 3.242 ± 0.036 |
4.912 ± 0.025 | 3.253 ± 0.023 |
6.125 ± 0.043 | 5.735 ± 0.036 |
5.342 ± 0.04 | 7.024 ± 0.034 |
1.431 ± 0.018 | 2.437 ± 0.023 |
Most of the basic statistics you can see at this page can be downloaded from this CSV file
See this proteome in:

Proteome-pI is available under Creative Commons Attribution-NoDerivs license, for more details see here
| Reference: Kozlowski LP. Proteome-pI 2.0: Proteome Isoelectric Point Database Update. Nucleic Acids Res. 2021, doi: 10.1093/nar/gkab944 | Contact: Lukasz P. Kozlowski |