Paenibacillus aquistagni
Taxonomy: cellular organisms; Bacteria; Terrabacteria group; Firmicutes; Bacilli; Bacillales; Paenibacillaceae; Paenibacillus
Average proteome isoelectric point is 6.26
Get precalculated fractions of proteins
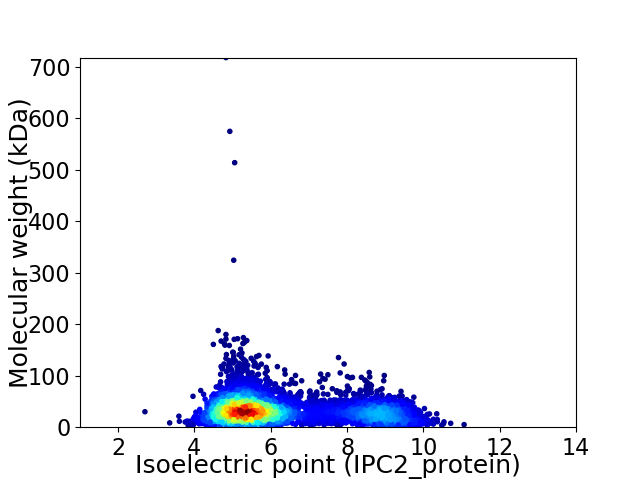
Virtual 2D-PAGE plot for 4778 proteins (isoelectric point calculated using IPC2_protein)
Get csv file with sequences according to given criteria:
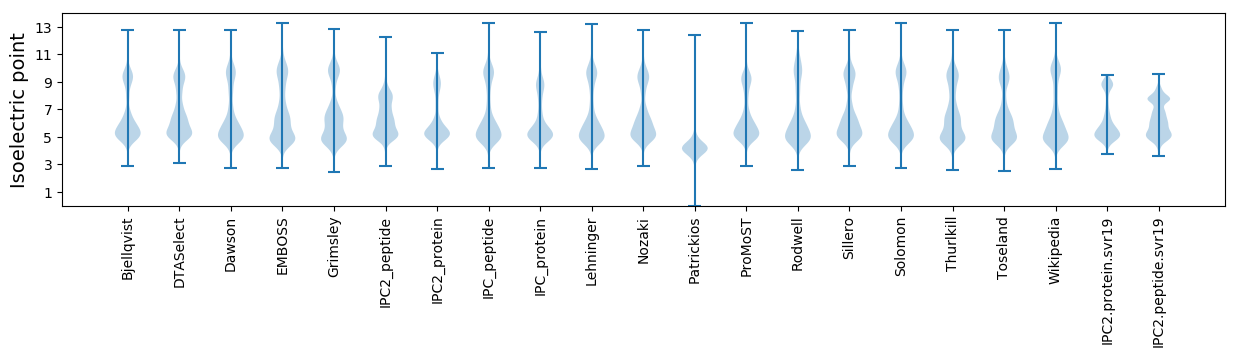
* You can choose from 21 different methods for calculating isoelectric point
Summary statistics related to proteome-wise predictions
Protein with the lowest isoelectric point:
>tr|A0A1X7I3H9|A0A1X7I3H9_9BACL Queuine tRNA-ribosyltransferase OS=Paenibacillus aquistagni OX=1852522 GN=tgt PE=3 SV=1
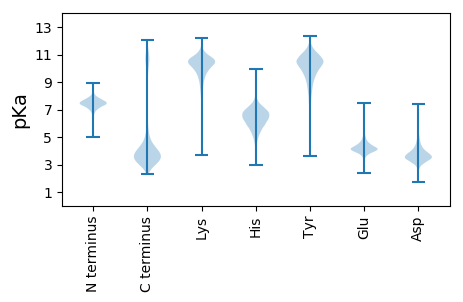
MM1 pKa = 7.2VNDD4 pKa = 4.01MRR6 pKa = 11.84CPNCNSKK13 pKa = 10.84DD14 pKa = 3.12IGKK17 pKa = 9.7IGSHH21 pKa = 6.05QFYY24 pKa = 10.47CWGCFIEE31 pKa = 4.51LTVNGDD37 pKa = 3.09KK38 pKa = 10.62MSVYY42 pKa = 10.04QVEE45 pKa = 4.22EE46 pKa = 4.6DD47 pKa = 3.68GTLSSLDD54 pKa = 3.75DD55 pKa = 4.63LFFGDD60 pKa = 4.99DD61 pKa = 3.7WLPTDD66 pKa = 3.66VGEE69 pKa = 4.63TQTSTQMM76 pKa = 3.47
MM1 pKa = 7.2VNDD4 pKa = 4.01MRR6 pKa = 11.84CPNCNSKK13 pKa = 10.84DD14 pKa = 3.12IGKK17 pKa = 9.7IGSHH21 pKa = 6.05QFYY24 pKa = 10.47CWGCFIEE31 pKa = 4.51LTVNGDD37 pKa = 3.09KK38 pKa = 10.62MSVYY42 pKa = 10.04QVEE45 pKa = 4.22EE46 pKa = 4.6DD47 pKa = 3.68GTLSSLDD54 pKa = 3.75DD55 pKa = 4.63LFFGDD60 pKa = 4.99DD61 pKa = 3.7WLPTDD66 pKa = 3.66VGEE69 pKa = 4.63TQTSTQMM76 pKa = 3.47
Molecular weight: 8.57 kDa
Isoelectric point according different methods:
Protein with the highest isoelectric point:
>tr|A0A1X7KKA9|A0A1X7KKA9_9BACL Two-component signal transduction system YycFG regulatory protein YycI OS=Paenibacillus aquistagni OX=1852522 GN=HII26_06980 PE=4 SV=1
MM1 pKa = 7.59KK2 pKa = 8.7PTFKK6 pKa = 10.81PNVSKK11 pKa = 10.8RR12 pKa = 11.84KK13 pKa = 8.79KK14 pKa = 8.3VHH16 pKa = 5.4GFRR19 pKa = 11.84ARR21 pKa = 11.84MSTKK25 pKa = 10.19NGRR28 pKa = 11.84KK29 pKa = 8.78VLAARR34 pKa = 11.84RR35 pKa = 11.84QKK37 pKa = 10.23GRR39 pKa = 11.84KK40 pKa = 8.56VLSAA44 pKa = 4.05
MM1 pKa = 7.59KK2 pKa = 8.7PTFKK6 pKa = 10.81PNVSKK11 pKa = 10.8RR12 pKa = 11.84KK13 pKa = 8.79KK14 pKa = 8.3VHH16 pKa = 5.4GFRR19 pKa = 11.84ARR21 pKa = 11.84MSTKK25 pKa = 10.19NGRR28 pKa = 11.84KK29 pKa = 8.78VLAARR34 pKa = 11.84RR35 pKa = 11.84QKK37 pKa = 10.23GRR39 pKa = 11.84KK40 pKa = 8.56VLSAA44 pKa = 4.05
Molecular weight: 5.05 kDa
Isoelectric point according different methods:
Peptides (in silico digests for buttom-up proteomics)
Below you can find in silico digests of the whole proteome with Trypsin, Chymotrypsin, Trypsin+LysC, LysN, ArgC proteases suitable for different mass spec machines.| Try ESI |
 |
|---|
| ChTry ESI |
|
|---|
| ArgC ESI |
|
|---|
| LysN ESI |
|
|---|
| TryLysC ESI |
|
|---|
| Try MALDI |
|
|---|
| ChTry MALDI |
|
|---|
| ArgC MALDI |
|
|---|
| LysN MALDI |
|
|---|
| TryLysC MALDI |
|
|---|
| Try LTQ |
|
|---|
| ChTry LTQ |
|
|---|
| ArgC LTQ |
|
|---|
| LysN LTQ |
|
|---|
| TryLysC LTQ |
|
|---|
| Try MSlow |
|
|---|
| ChTry MSlow |
|
|---|
| ArgC MSlow |
|
|---|
| LysN MSlow |
|
|---|
| TryLysC MSlow |
|
|---|
| Try MShigh |
|
|---|
| ChTry MShigh |
|
|---|
| ArgC MShigh |
|
|---|
| LysN MShigh |
|
|---|
| TryLysC MShigh |
|
|---|
General Statistics
Number of major isoforms |
Number of additional isoforms |
Number of all proteins |
Number of amino acids |
Min. Seq. Length |
Max. Seq. Length |
Avg. Seq. Length |
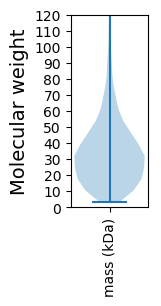
Avg. Mol. Weight |
|---|---|---|---|---|---|---|---|
0 |
1524220 |
29 |
6382 |
319.0 |
35.74 |
Amino acid frequency
Ala |
Cys |
Asp |
Glu |
Phe |
Gly |
His |
Ile |
Lys |
Leu |
|---|---|---|---|---|---|---|---|---|---|
8.16 ± 0.034 | 0.834 ± 0.012 |
5.112 ± 0.028 | 7.03 ± 0.043 |
3.933 ± 0.028 | 6.893 ± 0.03 |
2.502 ± 0.023 | 6.835 ± 0.032 |
5.322 ± 0.033 | 10.085 ± 0.045 |
Met |
Asn |
Gln |
Pro |
Arg |
Ser |
Thr |
Val |
Trp |
Tyr |
|---|---|---|---|---|---|---|---|---|---|
3.157 ± 0.015 | 3.59 ± 0.025 |
3.893 ± 0.019 | 4.341 ± 0.029 |
4.954 ± 0.031 | 6.276 ± 0.03 |
5.236 ± 0.028 | 6.979 ± 0.03 |
1.291 ± 0.015 | 3.576 ± 0.021 |
Most of the basic statistics you can see at this page can be downloaded from this CSV file
See this proteome in:

Proteome-pI is available under Creative Commons Attribution-NoDerivs license, for more details see here
| Reference: Kozlowski LP. Proteome-pI 2.0: Proteome Isoelectric Point Database Update. Nucleic Acids Res. 2021, doi: 10.1093/nar/gkab944 | Contact: Lukasz P. Kozlowski |