Lactococcus phage SK1 (Lactococcus lactis bacteriophage SK1)
Taxonomy: Viruses; Duplodnaviria; Heunggongvirae; Uroviricota; Caudoviricetes; Caudovirales; Siphoviridae; Skunavirus
Average proteome isoelectric point is 6.31
Get precalculated fractions of proteins
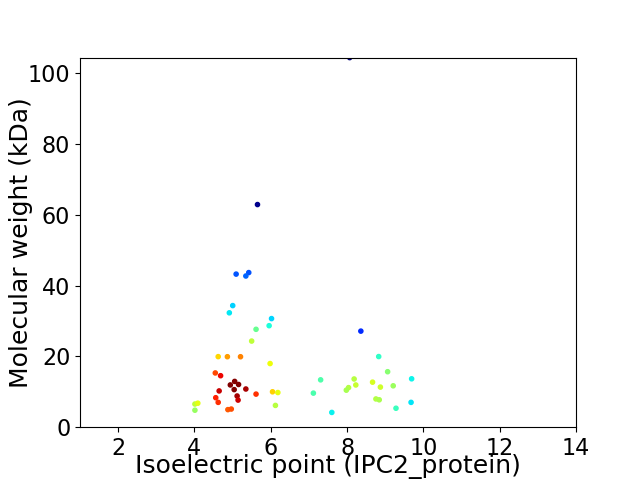
Virtual 2D-PAGE plot for 54 proteins (isoelectric point calculated using IPC2_protein)
Get csv file with sequences according to given criteria:
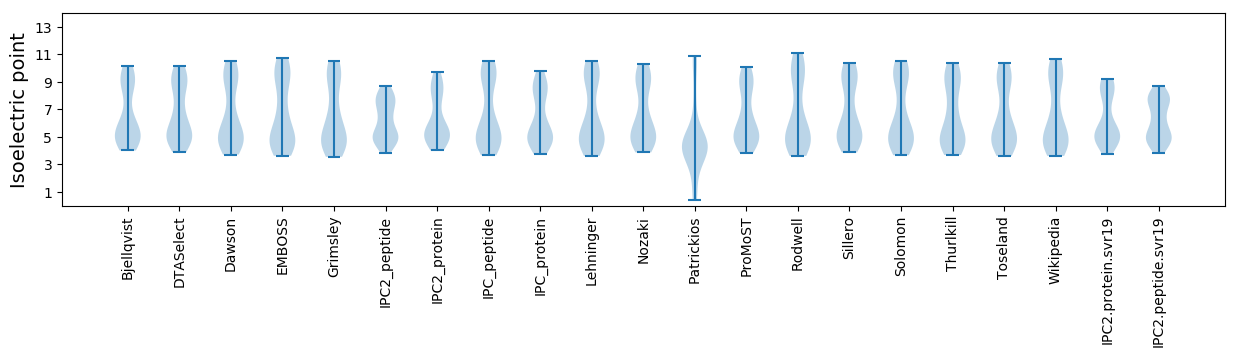
* You can choose from 21 different methods for calculating isoelectric point
Summary statistics related to proteome-wise predictions
Protein with the lowest isoelectric point:
>sp|O21878|TTTP_BPLSK Probable tail terminator protein OS=Lactococcus phage SK1 OX=31532 PE=3 SV=1
MM1 pKa = 7.56EE2 pKa = 5.5FDD4 pKa = 6.13SYY6 pKa = 11.42IDD8 pKa = 3.32WYY10 pKa = 11.58NNLLTMPLNDD20 pKa = 3.86VILGVKK26 pKa = 8.96DD27 pKa = 3.57TIEE30 pKa = 4.55DD31 pKa = 3.52KK32 pKa = 10.66TVYY35 pKa = 10.62LSLSDD40 pKa = 3.67SKK42 pKa = 11.01VIKK45 pKa = 9.72MDD47 pKa = 3.07NTSFVMGYY55 pKa = 9.14YY56 pKa = 10.49
MM1 pKa = 7.56EE2 pKa = 5.5FDD4 pKa = 6.13SYY6 pKa = 11.42IDD8 pKa = 3.32WYY10 pKa = 11.58NNLLTMPLNDD20 pKa = 3.86VILGVKK26 pKa = 8.96DD27 pKa = 3.57TIEE30 pKa = 4.55DD31 pKa = 3.52KK32 pKa = 10.66TVYY35 pKa = 10.62LSLSDD40 pKa = 3.67SKK42 pKa = 11.01VIKK45 pKa = 9.72MDD47 pKa = 3.07NTSFVMGYY55 pKa = 9.14YY56 pKa = 10.49
Molecular weight: 6.55 kDa
Isoelectric point according different methods:
Protein with the highest isoelectric point:
>tr|O21891|O21891_BPLSK Uncharacterized protein OS=Lactococcus phage SK1 OX=31532 PE=4 SV=1
MM1 pKa = 7.67ILHH4 pKa = 7.18KK5 pKa = 8.45YY6 pKa = 6.14TRR8 pKa = 11.84KK9 pKa = 9.83INSSKK14 pKa = 10.47YY15 pKa = 8.74PRR17 pKa = 11.84STARR21 pKa = 11.84KK22 pKa = 8.61IANDD26 pKa = 3.76LNKK29 pKa = 10.13NDD31 pKa = 4.17PFNNYY36 pKa = 8.99LVSLEE41 pKa = 4.65LGSKK45 pKa = 10.05RR46 pKa = 11.84YY47 pKa = 9.75IIEE50 pKa = 3.88KK51 pKa = 10.63FEE53 pKa = 4.11IKK55 pKa = 10.42GMNRR59 pKa = 3.04
MM1 pKa = 7.67ILHH4 pKa = 7.18KK5 pKa = 8.45YY6 pKa = 6.14TRR8 pKa = 11.84KK9 pKa = 9.83INSSKK14 pKa = 10.47YY15 pKa = 8.74PRR17 pKa = 11.84STARR21 pKa = 11.84KK22 pKa = 8.61IANDD26 pKa = 3.76LNKK29 pKa = 10.13NDD31 pKa = 4.17PFNNYY36 pKa = 8.99LVSLEE41 pKa = 4.65LGSKK45 pKa = 10.05RR46 pKa = 11.84YY47 pKa = 9.75IIEE50 pKa = 3.88KK51 pKa = 10.63FEE53 pKa = 4.11IKK55 pKa = 10.42GMNRR59 pKa = 3.04
Molecular weight: 7.02 kDa
Isoelectric point according different methods:
Peptides (in silico digests for buttom-up proteomics)
Below you can find in silico digests of the whole proteome with Trypsin, Chymotrypsin, Trypsin+LysC, LysN, ArgC proteases suitable for different mass spec machines.| Try ESI |
 |
|---|
| ChTry ESI |
|
|---|
| ArgC ESI |
|
|---|
| LysN ESI |
|
|---|
| TryLysC ESI |
|
|---|
| Try MALDI |
|
|---|
| ChTry MALDI |
|
|---|
| ArgC MALDI |
|
|---|
| LysN MALDI |
|
|---|
| TryLysC MALDI |
|
|---|
| Try LTQ |
|
|---|
| ChTry LTQ |
|
|---|
| ArgC LTQ |
|
|---|
| LysN LTQ |
|
|---|
| TryLysC LTQ |
|
|---|
| Try MSlow |
|
|---|
| ChTry MSlow |
|
|---|
| ArgC MSlow |
|
|---|
| LysN MSlow |
|
|---|
| TryLysC MSlow |
|
|---|
| Try MShigh |
|
|---|
| ChTry MShigh |
|
|---|
| ArgC MShigh |
|
|---|
| LysN MShigh |
|
|---|
| TryLysC MShigh |
|
|---|
General Statistics
Number of major isoforms |
Number of additional isoforms |
Number of all proteins |
Number of amino acids |
Min. Seq. Length |
Max. Seq. Length |
Avg. Seq. Length |
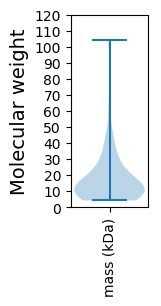
Avg. Mol. Weight |
|---|---|---|---|---|---|---|---|
0 |
8449 |
39 |
999 |
156.5 |
17.81 |
Amino acid frequency
Ala |
Cys |
Asp |
Glu |
Phe |
Gly |
His |
Ile |
Lys |
Leu |
|---|---|---|---|---|---|---|---|---|---|
6.001 ± 0.577 | 0.746 ± 0.203 |
5.622 ± 0.266 | 7.93 ± 0.735 |
4.45 ± 0.3 | 6.249 ± 0.753 |
1.148 ± 0.178 | 7.042 ± 0.29 |
9.054 ± 0.497 | 8.687 ± 0.353 |
Met |
Asn |
Gln |
Pro |
Arg |
Ser |
Thr |
Val |
Trp |
Tyr |
|---|---|---|---|---|---|---|---|---|---|
2.604 ± 0.215 | 6.32 ± 0.346 |
2.083 ± 0.261 | 3.539 ± 0.223 |
3.527 ± 0.295 | 6.486 ± 0.473 |
6.439 ± 0.28 | 6.261 ± 0.392 |
1.444 ± 0.176 | 4.367 ± 0.424 |
Most of the basic statistics you can see at this page can be downloaded from this CSV file
See this proteome in:

Proteome-pI is available under Creative Commons Attribution-NoDerivs license, for more details see here
| Reference: Kozlowski LP. Proteome-pI 2.0: Proteome Isoelectric Point Database Update. Nucleic Acids Res. 2021, doi: 10.1093/nar/gkab944 | Contact: Lukasz P. Kozlowski |