Hevea brasiliensis (Para rubber tree) (Siphonia brasiliensis)
Taxonomy: cellular organisms; Eukaryota; Viridiplantae; Streptophyta; Streptophytina; Embryophyta; Tracheophyta; Euphyllophyta; Spermatophyta; Magnoliopsida; Mesangiospermae; eudicotyledons; Gunneridae; Pentapetalae; rosids; fabids; Malpighiales; Euphorbiaceae; Crotonoideae; Micrandreae;
Average proteome isoelectric point is 6.51
Get precalculated fractions of proteins
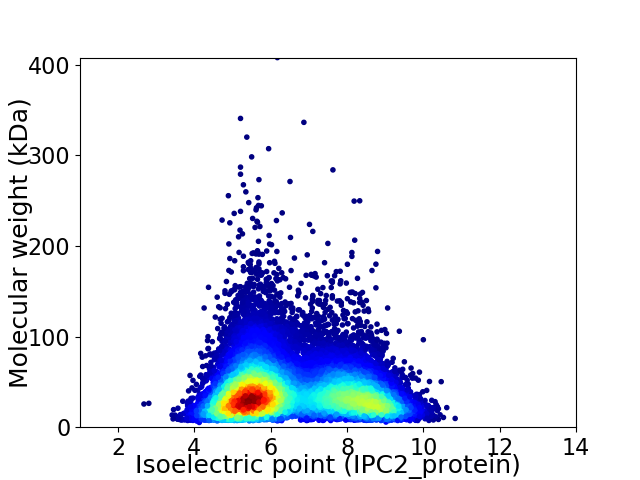
Virtual 2D-PAGE plot for 43024 proteins (isoelectric point calculated using IPC2_protein)
Get csv file with sequences according to given criteria:
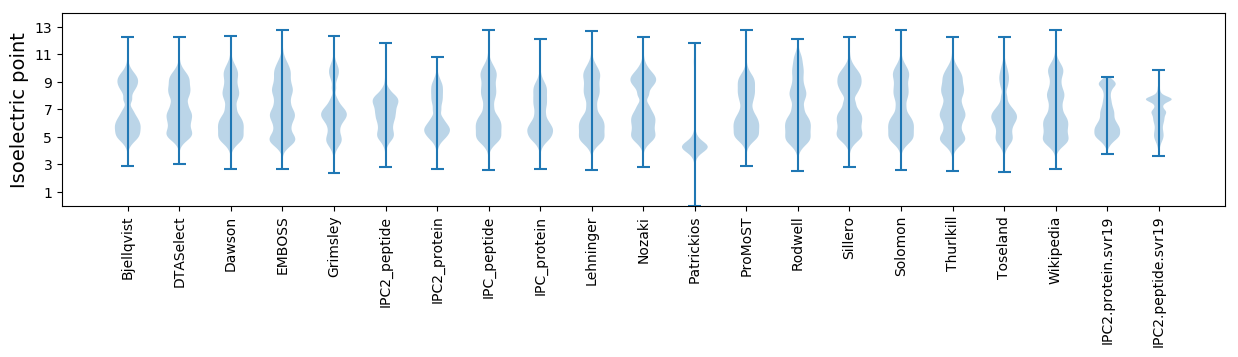
* You can choose from 21 different methods for calculating isoelectric point
Summary statistics related to proteome-wise predictions
Protein with the lowest isoelectric point:
>tr|A0A6A6MZS7|A0A6A6MZS7_HEVBR AAA domain-containing protein OS=Hevea brasiliensis OX=3981 GN=GH714_041282 PE=3 SV=1
MM1 pKa = 7.63GLQFDD6 pKa = 4.34VRR8 pKa = 11.84CSCVDD13 pKa = 3.45CLNVSIYY20 pKa = 10.4SQVVVLDD27 pKa = 3.63HH28 pKa = 7.06LLLKK32 pKa = 10.57GINKK36 pKa = 9.46FYY38 pKa = 10.59TRR40 pKa = 11.84WIHH43 pKa = 5.54YY44 pKa = 9.88KK45 pKa = 9.8EE46 pKa = 4.35APEE49 pKa = 4.68HH50 pKa = 5.15EE51 pKa = 4.64TSGGMLHH58 pKa = 7.22DD59 pKa = 6.03AIVDD63 pKa = 3.93MEE65 pKa = 4.3DD66 pKa = 3.62HH67 pKa = 6.51EE68 pKa = 4.98LAPFDD73 pKa = 4.42RR74 pKa = 11.84VDD76 pKa = 3.33VEE78 pKa = 4.35LNIVNVEE85 pKa = 4.21QVDD88 pKa = 3.87EE89 pKa = 4.34TLDD92 pKa = 3.33QQGRR96 pKa = 11.84DD97 pKa = 3.66FVVDD101 pKa = 3.79EE102 pKa = 4.0LHH104 pKa = 7.12EE105 pKa = 4.69RR106 pKa = 11.84DD107 pKa = 3.6EE108 pKa = 4.62TLDD111 pKa = 3.7EE112 pKa = 4.28YY113 pKa = 11.49CIDD116 pKa = 5.39EE117 pKa = 5.67DD118 pKa = 5.72DD119 pKa = 5.52LYY121 pKa = 11.67CNDD124 pKa = 5.41DD125 pKa = 4.24GEE127 pKa = 6.23DD128 pKa = 3.57DD129 pKa = 3.58
MM1 pKa = 7.63GLQFDD6 pKa = 4.34VRR8 pKa = 11.84CSCVDD13 pKa = 3.45CLNVSIYY20 pKa = 10.4SQVVVLDD27 pKa = 3.63HH28 pKa = 7.06LLLKK32 pKa = 10.57GINKK36 pKa = 9.46FYY38 pKa = 10.59TRR40 pKa = 11.84WIHH43 pKa = 5.54YY44 pKa = 9.88KK45 pKa = 9.8EE46 pKa = 4.35APEE49 pKa = 4.68HH50 pKa = 5.15EE51 pKa = 4.64TSGGMLHH58 pKa = 7.22DD59 pKa = 6.03AIVDD63 pKa = 3.93MEE65 pKa = 4.3DD66 pKa = 3.62HH67 pKa = 6.51EE68 pKa = 4.98LAPFDD73 pKa = 4.42RR74 pKa = 11.84VDD76 pKa = 3.33VEE78 pKa = 4.35LNIVNVEE85 pKa = 4.21QVDD88 pKa = 3.87EE89 pKa = 4.34TLDD92 pKa = 3.33QQGRR96 pKa = 11.84DD97 pKa = 3.66FVVDD101 pKa = 3.79EE102 pKa = 4.0LHH104 pKa = 7.12EE105 pKa = 4.69RR106 pKa = 11.84DD107 pKa = 3.6EE108 pKa = 4.62TLDD111 pKa = 3.7EE112 pKa = 4.28YY113 pKa = 11.49CIDD116 pKa = 5.39EE117 pKa = 5.67DD118 pKa = 5.72DD119 pKa = 5.52LYY121 pKa = 11.67CNDD124 pKa = 5.41DD125 pKa = 4.24GEE127 pKa = 6.23DD128 pKa = 3.57DD129 pKa = 3.58
Molecular weight: 14.98 kDa
Isoelectric point according different methods:
Protein with the highest isoelectric point:
>tr|A0A6A6NIL0|A0A6A6NIL0_HEVBR GRAS domain-containing protein OS=Hevea brasiliensis OX=3981 GN=GH714_022662 PE=3 SV=1
MM1 pKa = 7.55TSQLLRR7 pKa = 11.84KK8 pKa = 8.32WGSWDD13 pKa = 3.53LLRR16 pKa = 11.84AKK18 pKa = 10.49LGALPTRR25 pKa = 11.84ISQKK29 pKa = 9.98LGTRR33 pKa = 11.84HH34 pKa = 5.08VPVVRR39 pKa = 11.84GDD41 pKa = 4.1SGWDD45 pKa = 3.33AAGLSADD52 pKa = 3.86PEE54 pKa = 4.2TFARR58 pKa = 11.84IRR60 pKa = 11.84EE61 pKa = 4.29LEE63 pKa = 4.3VIHH66 pKa = 6.46CRR68 pKa = 11.84WAMLGALGCLFPEE81 pKa = 4.33HH82 pKa = 7.01LARR85 pKa = 11.84TEE87 pKa = 3.83LSLAKK92 pKa = 10.06QCFSRR97 pKa = 11.84LVLKK101 pKa = 10.15FSATLILTTWGFPASSMGYY120 pKa = 9.05QVVLMYY126 pKa = 10.48RR127 pKa = 11.84IAGEE131 pKa = 3.83PLVRR135 pKa = 11.84SLTRR139 pKa = 11.84YY140 pKa = 8.61LVPRR144 pKa = 11.84RR145 pKa = 11.84NLL147 pKa = 3.21
MM1 pKa = 7.55TSQLLRR7 pKa = 11.84KK8 pKa = 8.32WGSWDD13 pKa = 3.53LLRR16 pKa = 11.84AKK18 pKa = 10.49LGALPTRR25 pKa = 11.84ISQKK29 pKa = 9.98LGTRR33 pKa = 11.84HH34 pKa = 5.08VPVVRR39 pKa = 11.84GDD41 pKa = 4.1SGWDD45 pKa = 3.33AAGLSADD52 pKa = 3.86PEE54 pKa = 4.2TFARR58 pKa = 11.84IRR60 pKa = 11.84EE61 pKa = 4.29LEE63 pKa = 4.3VIHH66 pKa = 6.46CRR68 pKa = 11.84WAMLGALGCLFPEE81 pKa = 4.33HH82 pKa = 7.01LARR85 pKa = 11.84TEE87 pKa = 3.83LSLAKK92 pKa = 10.06QCFSRR97 pKa = 11.84LVLKK101 pKa = 10.15FSATLILTTWGFPASSMGYY120 pKa = 9.05QVVLMYY126 pKa = 10.48RR127 pKa = 11.84IAGEE131 pKa = 3.83PLVRR135 pKa = 11.84SLTRR139 pKa = 11.84YY140 pKa = 8.61LVPRR144 pKa = 11.84RR145 pKa = 11.84NLL147 pKa = 3.21
Molecular weight: 16.54 kDa
Isoelectric point according different methods:
Peptides (in silico digests for buttom-up proteomics)
Below you can find in silico digests of the whole proteome with Trypsin, Chymotrypsin, Trypsin+LysC, LysN, ArgC proteases suitable for different mass spec machines.| Try ESI |
 |
|---|
| ChTry ESI |
|
|---|
| ArgC ESI |
|
|---|
| LysN ESI |
|
|---|
| TryLysC ESI |
|
|---|
| Try MALDI |
|
|---|
| ChTry MALDI |
|
|---|
| ArgC MALDI |
|
|---|
| LysN MALDI |
|
|---|
| TryLysC MALDI |
|
|---|
| Try LTQ |
|
|---|
| ChTry LTQ |
|
|---|
| ArgC LTQ |
|
|---|
| LysN LTQ |
|
|---|
| TryLysC LTQ |
|
|---|
| Try MSlow |
|
|---|
| ChTry MSlow |
|
|---|
| ArgC MSlow |
|
|---|
| LysN MSlow |
|
|---|
| TryLysC MSlow |
|
|---|
| Try MShigh |
|
|---|
| ChTry MShigh |
|
|---|
| ArgC MShigh |
|
|---|
| LysN MShigh |
|
|---|
| TryLysC MShigh |
|
|---|
General Statistics
Number of major isoforms |
Number of additional isoforms |
Number of all proteins |
Number of amino acids |
Min. Seq. Length |
Max. Seq. Length |
Avg. Seq. Length |
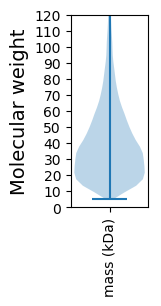
Avg. Mol. Weight |
|---|---|---|---|---|---|---|---|
0 |
16386060 |
49 |
3639 |
380.9 |
42.52 |
Amino acid frequency
Ala |
Cys |
Asp |
Glu |
Phe |
Gly |
His |
Ile |
Lys |
Leu |
|---|---|---|---|---|---|---|---|---|---|
6.757 ± 0.011 | 1.867 ± 0.005 |
5.327 ± 0.008 | 6.592 ± 0.012 |
4.174 ± 0.007 | 6.624 ± 0.011 |
2.337 ± 0.005 | 5.479 ± 0.008 |
6.13 ± 0.011 | 9.854 ± 0.015 |
Met |
Asn |
Gln |
Pro |
Arg |
Ser |
Thr |
Val |
Trp |
Tyr |
|---|---|---|---|---|---|---|---|---|---|
2.497 ± 0.005 | 4.586 ± 0.008 |
4.719 ± 0.01 | 3.713 ± 0.008 |
5.185 ± 0.009 | 8.778 ± 0.014 |
4.749 ± 0.006 | 6.503 ± 0.008 |
1.331 ± 0.004 | 2.797 ± 0.007 |
Most of the basic statistics you can see at this page can be downloaded from this CSV file
See this proteome in:

Proteome-pI is available under Creative Commons Attribution-NoDerivs license, for more details see here
| Reference: Kozlowski LP. Proteome-pI 2.0: Proteome Isoelectric Point Database Update. Nucleic Acids Res. 2021, doi: 10.1093/nar/gkab944 | Contact: Lukasz P. Kozlowski |