Helicobacter sp. MIT 14-3879
Taxonomy: cellular organisms; Bacteria; Proteobacteria; delta/epsilon subdivisions; Epsilonproteobacteria; Campylobacterales; Helicobacteraceae; Helicobacter; unclassified Helicobacter
Average proteome isoelectric point is 7.08
Get precalculated fractions of proteins
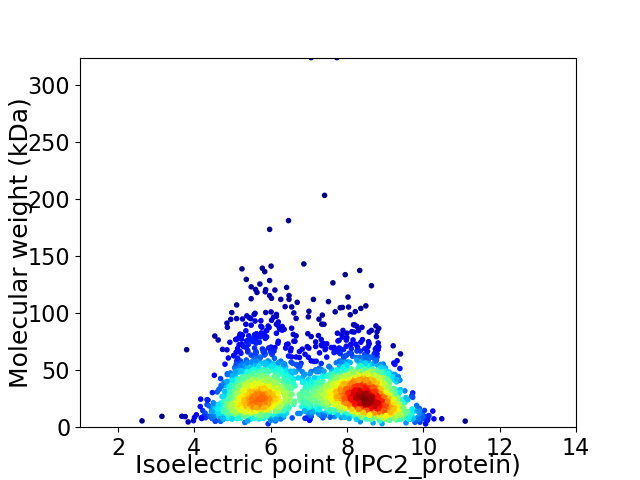
Virtual 2D-PAGE plot for 2319 proteins (isoelectric point calculated using IPC2_protein)
Get csv file with sequences according to given criteria:
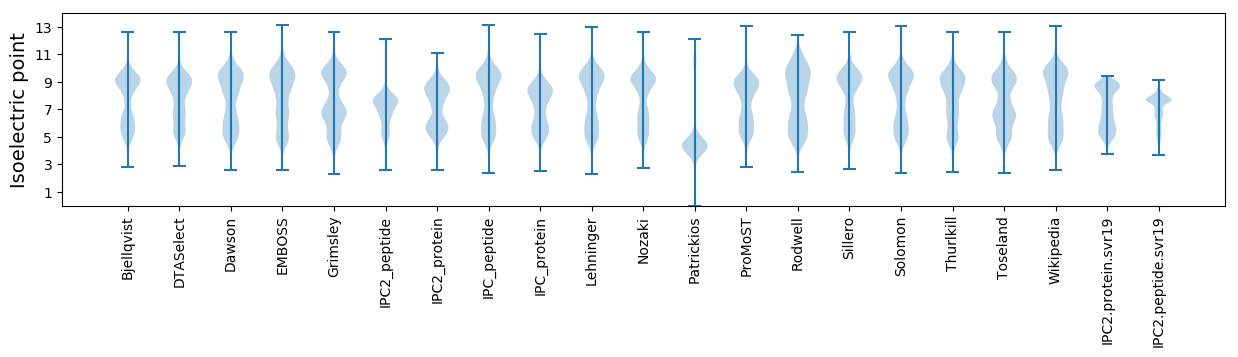
* You can choose from 21 different methods for calculating isoelectric point
Summary statistics related to proteome-wise predictions
Protein with the lowest isoelectric point:
>tr|A0A3D8I5H4|A0A3D8I5H4_9HELI Flagellar hook-associated protein FlgL OS=Helicobacter sp. MIT 14-3879 OX=2040649 GN=CQA44_10565 PE=4 SV=1
MM1 pKa = 7.94RR2 pKa = 11.84ISFIDD7 pKa = 3.8ANGHH11 pKa = 3.93TTLWDD16 pKa = 3.17KK17 pKa = 11.9DD18 pKa = 3.97NFVDD22 pKa = 3.75TALGVSANYY31 pKa = 10.43LNEE34 pKa = 3.98TQYY37 pKa = 10.91IIQDD41 pKa = 3.95LYY43 pKa = 10.81FWDD46 pKa = 5.18LIGG49 pKa = 4.91
MM1 pKa = 7.94RR2 pKa = 11.84ISFIDD7 pKa = 3.8ANGHH11 pKa = 3.93TTLWDD16 pKa = 3.17KK17 pKa = 11.9DD18 pKa = 3.97NFVDD22 pKa = 3.75TALGVSANYY31 pKa = 10.43LNEE34 pKa = 3.98TQYY37 pKa = 10.91IIQDD41 pKa = 3.95LYY43 pKa = 10.81FWDD46 pKa = 5.18LIGG49 pKa = 4.91
Molecular weight: 5.7 kDa
Isoelectric point according different methods:
Protein with the highest isoelectric point:
>tr|A0A3D8IJW1|A0A3D8IJW1_9HELI Flagellar basal-body rod protein FlgG OS=Helicobacter sp. MIT 14-3879 OX=2040649 GN=flgG PE=3 SV=1
MM1 pKa = 7.28KK2 pKa = 9.44RR3 pKa = 11.84TYY5 pKa = 10.07QPHH8 pKa = 5.72NKK10 pKa = 8.48PRR12 pKa = 11.84KK13 pKa = 7.33STHH16 pKa = 4.76GFRR19 pKa = 11.84ARR21 pKa = 11.84MKK23 pKa = 8.77TKK25 pKa = 10.06NGQRR29 pKa = 11.84VIRR32 pKa = 11.84NRR34 pKa = 11.84RR35 pKa = 11.84AKK37 pKa = 9.63GRR39 pKa = 11.84KK40 pKa = 8.69RR41 pKa = 11.84LAVV44 pKa = 3.41
MM1 pKa = 7.28KK2 pKa = 9.44RR3 pKa = 11.84TYY5 pKa = 10.07QPHH8 pKa = 5.72NKK10 pKa = 8.48PRR12 pKa = 11.84KK13 pKa = 7.33STHH16 pKa = 4.76GFRR19 pKa = 11.84ARR21 pKa = 11.84MKK23 pKa = 8.77TKK25 pKa = 10.06NGQRR29 pKa = 11.84VIRR32 pKa = 11.84NRR34 pKa = 11.84RR35 pKa = 11.84AKK37 pKa = 9.63GRR39 pKa = 11.84KK40 pKa = 8.69RR41 pKa = 11.84LAVV44 pKa = 3.41
Molecular weight: 5.32 kDa
Isoelectric point according different methods:
Peptides (in silico digests for buttom-up proteomics)
Below you can find in silico digests of the whole proteome with Trypsin, Chymotrypsin, Trypsin+LysC, LysN, ArgC proteases suitable for different mass spec machines.| Try ESI |
 |
|---|
| ChTry ESI |
|
|---|
| ArgC ESI |
|
|---|
| LysN ESI |
|
|---|
| TryLysC ESI |
|
|---|
| Try MALDI |
|
|---|
| ChTry MALDI |
|
|---|
| ArgC MALDI |
|
|---|
| LysN MALDI |
|
|---|
| TryLysC MALDI |
|
|---|
| Try LTQ |
|
|---|
| ChTry LTQ |
|
|---|
| ArgC LTQ |
|
|---|
| LysN LTQ |
|
|---|
| TryLysC LTQ |
|
|---|
| Try MSlow |
|
|---|
| ChTry MSlow |
|
|---|
| ArgC MSlow |
|
|---|
| LysN MSlow |
|
|---|
| TryLysC MSlow |
|
|---|
| Try MShigh |
|
|---|
| ChTry MShigh |
|
|---|
| ArgC MShigh |
|
|---|
| LysN MShigh |
|
|---|
| TryLysC MShigh |
|
|---|
General Statistics
Number of major isoforms |
Number of additional isoforms |
Number of all proteins |
Number of amino acids |
Min. Seq. Length |
Max. Seq. Length |
Avg. Seq. Length |
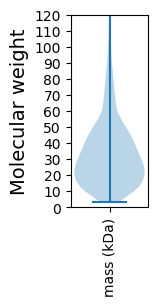
Avg. Mol. Weight |
|---|---|---|---|---|---|---|---|
0 |
715090 |
25 |
2887 |
308.4 |
35.02 |
Amino acid frequency
Ala |
Cys |
Asp |
Glu |
Phe |
Gly |
His |
Ile |
Lys |
Leu |
|---|---|---|---|---|---|---|---|---|---|
5.698 ± 0.051 | 1.178 ± 0.019 |
5.323 ± 0.037 | 6.12 ± 0.048 |
5.419 ± 0.049 | 5.497 ± 0.048 |
1.637 ± 0.021 | 10.5 ± 0.063 |
8.814 ± 0.059 | 9.957 ± 0.056 |
Met |
Asn |
Gln |
Pro |
Arg |
Ser |
Thr |
Val |
Trp |
Tyr |
|---|---|---|---|---|---|---|---|---|---|
2.172 ± 0.023 | 7.227 ± 0.063 |
2.806 ± 0.028 | 3.085 ± 0.031 |
3.317 ± 0.029 | 7.329 ± 0.039 |
4.276 ± 0.03 | 4.87 ± 0.043 |
0.654 ± 0.016 | 4.12 ± 0.032 |
Most of the basic statistics you can see at this page can be downloaded from this CSV file
See this proteome in:

Proteome-pI is available under Creative Commons Attribution-NoDerivs license, for more details see here
| Reference: Kozlowski LP. Proteome-pI 2.0: Proteome Isoelectric Point Database Update. Nucleic Acids Res. 2021, doi: 10.1093/nar/gkab944 | Contact: Lukasz P. Kozlowski |