Hymenobacter sp. CRA2
Taxonomy: cellular organisms; Bacteria; FCB group; Bacteroidetes/Chlorobi group; Bacteroidetes; Cytophagia; Cytophagales; Hymenobacteraceae; Hymenobacter; unclassified Hymenobacter
Average proteome isoelectric point is 6.9
Get precalculated fractions of proteins
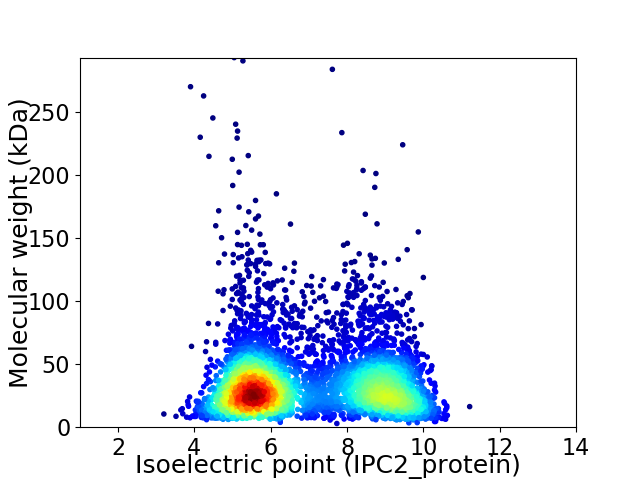
Virtual 2D-PAGE plot for 4792 proteins (isoelectric point calculated using IPC2_protein)
Get csv file with sequences according to given criteria:
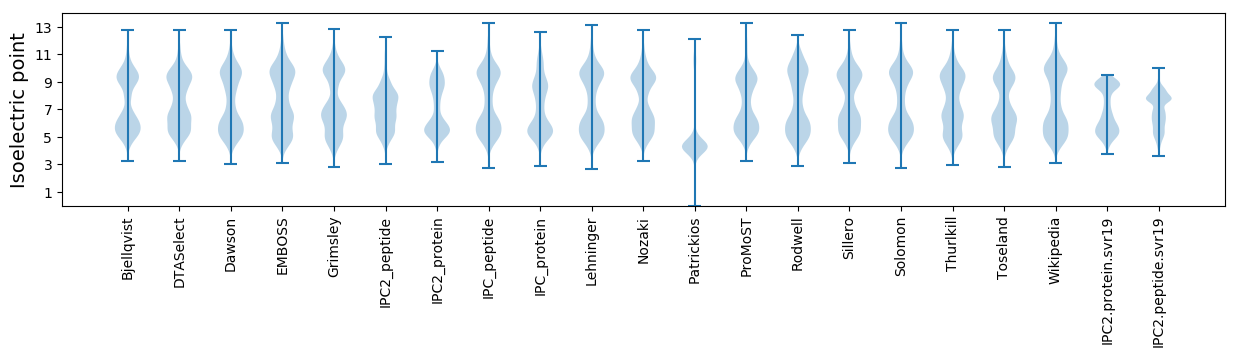
* You can choose from 21 different methods for calculating isoelectric point
Summary statistics related to proteome-wise predictions
Protein with the lowest isoelectric point:
>tr|A0A1S9ART8|A0A1S9ART8_9BACT Ferredoxin--NADP reductase OS=Hymenobacter sp. CRA2 OX=1955620 GN=B0919_22255 PE=3 SV=1
MM1 pKa = 7.78ISTKK5 pKa = 10.58NYY7 pKa = 10.06AALPDD12 pKa = 3.83AAALQQLCKK21 pKa = 10.92AMAVLDD27 pKa = 5.07AINSPEE33 pKa = 3.53WEE35 pKa = 4.27YY36 pKa = 10.93RR37 pKa = 11.84YY38 pKa = 10.3HH39 pKa = 8.16SYY41 pKa = 11.38DD42 pKa = 3.63PAWGLDD48 pKa = 3.3EE49 pKa = 6.68AVFQLNTGEE58 pKa = 4.13GDD60 pKa = 3.27EE61 pKa = 4.19MLVIFRR67 pKa = 11.84PEE69 pKa = 4.09GCCINGFIDD78 pKa = 6.49GYY80 pKa = 10.43AQPDD84 pKa = 3.74KK85 pKa = 11.42AQVTQGLPAAFEE97 pKa = 4.05EE98 pKa = 5.17FVFGEE103 pKa = 4.49PVASIGTTFCLWYY116 pKa = 9.39TPTQGWQTGVVDD128 pKa = 4.78EE129 pKa = 4.79NADD132 pKa = 3.9DD133 pKa = 4.63GSEE136 pKa = 3.96EE137 pKa = 3.95MLYY140 pKa = 10.89LFDD143 pKa = 5.08GRR145 pKa = 11.84PEE147 pKa = 5.0AYY149 pKa = 9.28TEE151 pKa = 3.82WANEE155 pKa = 3.88YY156 pKa = 10.13FVEE159 pKa = 4.27DD160 pKa = 3.64TGRR163 pKa = 11.84QLIDD167 pKa = 3.31AADD170 pKa = 3.48VSRR173 pKa = 11.84VYY175 pKa = 10.54RR176 pKa = 11.84GEE178 pKa = 4.03VLTKK182 pKa = 10.41EE183 pKa = 3.76AVQRR187 pKa = 11.84INEE190 pKa = 4.15EE191 pKa = 4.19TEE193 pKa = 3.79DD194 pKa = 3.7WAQLEE199 pKa = 4.4ADD201 pKa = 4.21LQEE204 pKa = 4.37IGYY207 pKa = 8.89PYY209 pKa = 10.82DD210 pKa = 3.44FSKK213 pKa = 11.39
MM1 pKa = 7.78ISTKK5 pKa = 10.58NYY7 pKa = 10.06AALPDD12 pKa = 3.83AAALQQLCKK21 pKa = 10.92AMAVLDD27 pKa = 5.07AINSPEE33 pKa = 3.53WEE35 pKa = 4.27YY36 pKa = 10.93RR37 pKa = 11.84YY38 pKa = 10.3HH39 pKa = 8.16SYY41 pKa = 11.38DD42 pKa = 3.63PAWGLDD48 pKa = 3.3EE49 pKa = 6.68AVFQLNTGEE58 pKa = 4.13GDD60 pKa = 3.27EE61 pKa = 4.19MLVIFRR67 pKa = 11.84PEE69 pKa = 4.09GCCINGFIDD78 pKa = 6.49GYY80 pKa = 10.43AQPDD84 pKa = 3.74KK85 pKa = 11.42AQVTQGLPAAFEE97 pKa = 4.05EE98 pKa = 5.17FVFGEE103 pKa = 4.49PVASIGTTFCLWYY116 pKa = 9.39TPTQGWQTGVVDD128 pKa = 4.78EE129 pKa = 4.79NADD132 pKa = 3.9DD133 pKa = 4.63GSEE136 pKa = 3.96EE137 pKa = 3.95MLYY140 pKa = 10.89LFDD143 pKa = 5.08GRR145 pKa = 11.84PEE147 pKa = 5.0AYY149 pKa = 9.28TEE151 pKa = 3.82WANEE155 pKa = 3.88YY156 pKa = 10.13FVEE159 pKa = 4.27DD160 pKa = 3.64TGRR163 pKa = 11.84QLIDD167 pKa = 3.31AADD170 pKa = 3.48VSRR173 pKa = 11.84VYY175 pKa = 10.54RR176 pKa = 11.84GEE178 pKa = 4.03VLTKK182 pKa = 10.41EE183 pKa = 3.76AVQRR187 pKa = 11.84INEE190 pKa = 4.15EE191 pKa = 4.19TEE193 pKa = 3.79DD194 pKa = 3.7WAQLEE199 pKa = 4.4ADD201 pKa = 4.21LQEE204 pKa = 4.37IGYY207 pKa = 8.89PYY209 pKa = 10.82DD210 pKa = 3.44FSKK213 pKa = 11.39
Molecular weight: 23.98 kDa
Isoelectric point according different methods:
Protein with the highest isoelectric point:
>tr|A0A1S9AQY9|A0A1S9AQY9_9BACT DDE_Tnp_1 domain-containing protein OS=Hymenobacter sp. CRA2 OX=1955620 GN=B0919_23455 PE=4 SV=1
MM1 pKa = 7.05PHH3 pKa = 4.79VVKK6 pKa = 10.64YY7 pKa = 10.91ASVFLLSMVKK17 pKa = 10.42FFGGPLAGAAAGLPFMAIWALTVAGMMTSVVVFTGVGRR55 pKa = 11.84AFTAHH60 pKa = 6.17LQRR63 pKa = 11.84RR64 pKa = 11.84RR65 pKa = 11.84RR66 pKa = 11.84LRR68 pKa = 11.84HH69 pKa = 4.5QPIFTRR75 pKa = 11.84RR76 pKa = 11.84SRR78 pKa = 11.84QIVRR82 pKa = 11.84VFSRR86 pKa = 11.84FGIGGIAFLTPILFTPIGGAVIATLLGVKK115 pKa = 9.61RR116 pKa = 11.84QHH118 pKa = 6.75ILLHH122 pKa = 5.55MLWSALLWGAAGAFLAIRR140 pKa = 11.84FSHH143 pKa = 6.57LFIRR147 pKa = 11.84HH148 pKa = 4.9
MM1 pKa = 7.05PHH3 pKa = 4.79VVKK6 pKa = 10.64YY7 pKa = 10.91ASVFLLSMVKK17 pKa = 10.42FFGGPLAGAAAGLPFMAIWALTVAGMMTSVVVFTGVGRR55 pKa = 11.84AFTAHH60 pKa = 6.17LQRR63 pKa = 11.84RR64 pKa = 11.84RR65 pKa = 11.84RR66 pKa = 11.84LRR68 pKa = 11.84HH69 pKa = 4.5QPIFTRR75 pKa = 11.84RR76 pKa = 11.84SRR78 pKa = 11.84QIVRR82 pKa = 11.84VFSRR86 pKa = 11.84FGIGGIAFLTPILFTPIGGAVIATLLGVKK115 pKa = 9.61RR116 pKa = 11.84QHH118 pKa = 6.75ILLHH122 pKa = 5.55MLWSALLWGAAGAFLAIRR140 pKa = 11.84FSHH143 pKa = 6.57LFIRR147 pKa = 11.84HH148 pKa = 4.9
Molecular weight: 16.34 kDa
Isoelectric point according different methods:
Peptides (in silico digests for buttom-up proteomics)
Below you can find in silico digests of the whole proteome with Trypsin, Chymotrypsin, Trypsin+LysC, LysN, ArgC proteases suitable for different mass spec machines.| Try ESI |
 |
|---|
| ChTry ESI |
|
|---|
| ArgC ESI |
|
|---|
| LysN ESI |
|
|---|
| TryLysC ESI |
|
|---|
| Try MALDI |
|
|---|
| ChTry MALDI |
|
|---|
| ArgC MALDI |
|
|---|
| LysN MALDI |
|
|---|
| TryLysC MALDI |
|
|---|
| Try LTQ |
|
|---|
| ChTry LTQ |
|
|---|
| ArgC LTQ |
|
|---|
| LysN LTQ |
|
|---|
| TryLysC LTQ |
|
|---|
| Try MSlow |
|
|---|
| ChTry MSlow |
|
|---|
| ArgC MSlow |
|
|---|
| LysN MSlow |
|
|---|
| TryLysC MSlow |
|
|---|
| Try MShigh |
|
|---|
| ChTry MShigh |
|
|---|
| ArgC MShigh |
|
|---|
| LysN MShigh |
|
|---|
| TryLysC MShigh |
|
|---|
General Statistics
Number of major isoforms |
Number of additional isoforms |
Number of all proteins |
Number of amino acids |
Min. Seq. Length |
Max. Seq. Length |
Avg. Seq. Length |
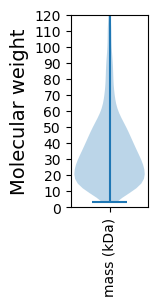
Avg. Mol. Weight |
|---|---|---|---|---|---|---|---|
0 |
1648900 |
26 |
2720 |
344.1 |
37.91 |
Amino acid frequency
Ala |
Cys |
Asp |
Glu |
Phe |
Gly |
His |
Ile |
Lys |
Leu |
|---|---|---|---|---|---|---|---|---|---|
10.886 ± 0.049 | 0.729 ± 0.01 |
4.962 ± 0.024 | 5.221 ± 0.042 |
3.873 ± 0.023 | 7.748 ± 0.042 |
2.118 ± 0.022 | 4.002 ± 0.031 |
3.544 ± 0.037 | 10.983 ± 0.056 |
Met |
Asn |
Gln |
Pro |
Arg |
Ser |
Thr |
Val |
Trp |
Tyr |
|---|---|---|---|---|---|---|---|---|---|
1.816 ± 0.017 | 3.606 ± 0.038 |
5.324 ± 0.029 | 5.02 ± 0.027 |
6.504 ± 0.036 | 5.345 ± 0.038 |
6.168 ± 0.055 | 7.244 ± 0.029 |
1.361 ± 0.015 | 3.548 ± 0.024 |
Most of the basic statistics you can see at this page can be downloaded from this CSV file
See this proteome in:

Proteome-pI is available under Creative Commons Attribution-NoDerivs license, for more details see here
| Reference: Kozlowski LP. Proteome-pI 2.0: Proteome Isoelectric Point Database Update. Nucleic Acids Res. 2021, doi: 10.1093/nar/gkab944 | Contact: Lukasz P. Kozlowski |