Staphylococcus phage phiSa2wa_st5
Taxonomy: Viruses; Duplodnaviria; Heunggongvirae; Uroviricota; Caudoviricetes; Caudovirales; Siphoviridae; Triavirus; Staphylococcus virus st5
Average proteome isoelectric point is 6.54
Get precalculated fractions of proteins
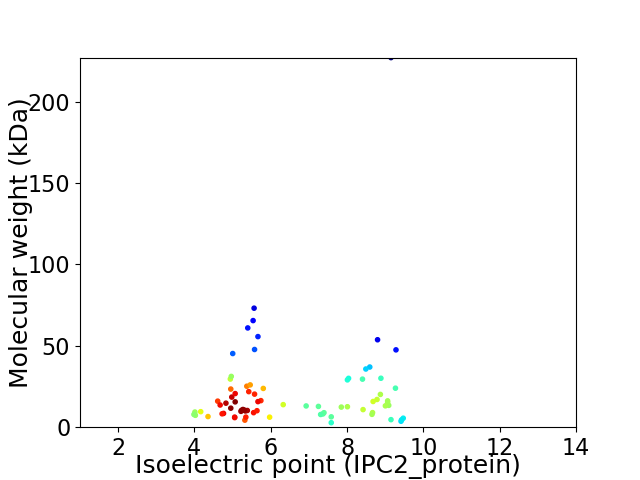
Virtual 2D-PAGE plot for 77 proteins (isoelectric point calculated using IPC2_protein)
Get csv file with sequences according to given criteria:
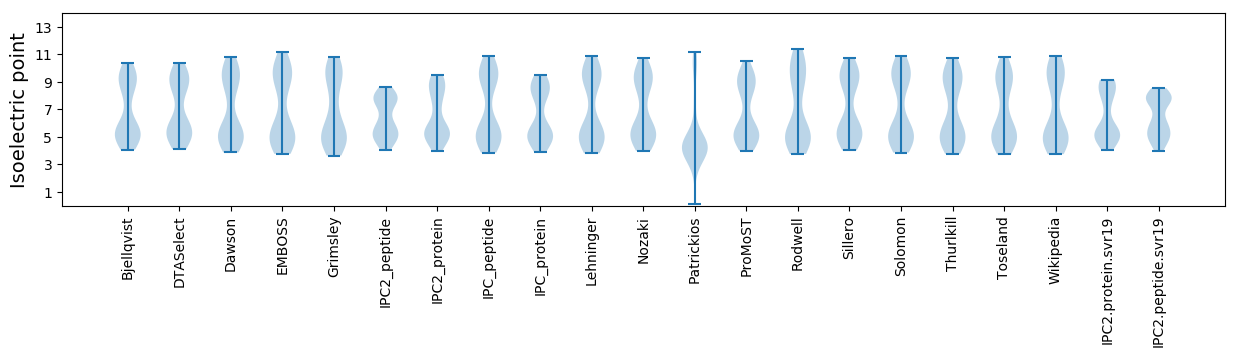
* You can choose from 21 different methods for calculating isoelectric point
Summary statistics related to proteome-wise predictions
Protein with the lowest isoelectric point:
>tr|A0A2I6PDA4|A0A2I6PDA4_9CAUD Uncharacterized protein OS=Staphylococcus phage phiSa2wa_st5 OX=2060951 PE=4 SV=1
MM1 pKa = 6.89QQQAYY6 pKa = 9.38INATIDD12 pKa = 2.95IRR14 pKa = 11.84IPTEE18 pKa = 2.96VDD20 pKa = 3.24YY21 pKa = 11.49QHH23 pKa = 7.01FDD25 pKa = 3.49DD26 pKa = 4.54VDD28 pKa = 3.67KK29 pKa = 11.4EE30 pKa = 4.28KK31 pKa = 10.38EE32 pKa = 4.13TLADD36 pKa = 3.57YY37 pKa = 10.81LYY39 pKa = 10.9NNPDD43 pKa = 3.71EE44 pKa = 4.28ILEE47 pKa = 3.92YY48 pKa = 11.25DD49 pKa = 3.43NLKK52 pKa = 9.69IRR54 pKa = 11.84NVNVEE59 pKa = 3.93VEE61 pKa = 4.1
MM1 pKa = 6.89QQQAYY6 pKa = 9.38INATIDD12 pKa = 2.95IRR14 pKa = 11.84IPTEE18 pKa = 2.96VDD20 pKa = 3.24YY21 pKa = 11.49QHH23 pKa = 7.01FDD25 pKa = 3.49DD26 pKa = 4.54VDD28 pKa = 3.67KK29 pKa = 11.4EE30 pKa = 4.28KK31 pKa = 10.38EE32 pKa = 4.13TLADD36 pKa = 3.57YY37 pKa = 10.81LYY39 pKa = 10.9NNPDD43 pKa = 3.71EE44 pKa = 4.28ILEE47 pKa = 3.92YY48 pKa = 11.25DD49 pKa = 3.43NLKK52 pKa = 9.69IRR54 pKa = 11.84NVNVEE59 pKa = 3.93VEE61 pKa = 4.1
Molecular weight: 7.31 kDa
Isoelectric point according different methods:
Protein with the highest isoelectric point:
>tr|A0A2I6PDF9|A0A2I6PDF9_9CAUD Holin OS=Staphylococcus phage phiSa2wa_st5 OX=2060951 GN=hol PE=4 SV=1
MM1 pKa = 7.54IKK3 pKa = 10.33KK4 pKa = 9.52LLWSTISWFYY14 pKa = 11.55VYY16 pKa = 10.47YY17 pKa = 9.12QSKK20 pKa = 9.42YY21 pKa = 10.26KK22 pKa = 10.83LFIICLVMNGFFSKK36 pKa = 10.93
MM1 pKa = 7.54IKK3 pKa = 10.33KK4 pKa = 9.52LLWSTISWFYY14 pKa = 11.55VYY16 pKa = 10.47YY17 pKa = 9.12QSKK20 pKa = 9.42YY21 pKa = 10.26KK22 pKa = 10.83LFIICLVMNGFFSKK36 pKa = 10.93
Molecular weight: 4.49 kDa
Isoelectric point according different methods:
Peptides (in silico digests for buttom-up proteomics)
Below you can find in silico digests of the whole proteome with Trypsin, Chymotrypsin, Trypsin+LysC, LysN, ArgC proteases suitable for different mass spec machines.| Try ESI |
 |
|---|
| ChTry ESI |
|
|---|
| ArgC ESI |
|
|---|
| LysN ESI |
|
|---|
| TryLysC ESI |
|
|---|
| Try MALDI |
|
|---|
| ChTry MALDI |
|
|---|
| ArgC MALDI |
|
|---|
| LysN MALDI |
|
|---|
| TryLysC MALDI |
|
|---|
| Try LTQ |
|
|---|
| ChTry LTQ |
|
|---|
| ArgC LTQ |
|
|---|
| LysN LTQ |
|
|---|
| TryLysC LTQ |
|
|---|
| Try MSlow |
|
|---|
| ChTry MSlow |
|
|---|
| ArgC MSlow |
|
|---|
| LysN MSlow |
|
|---|
| TryLysC MSlow |
|
|---|
| Try MShigh |
|
|---|
| ChTry MShigh |
|
|---|
| ArgC MShigh |
|
|---|
| LysN MShigh |
|
|---|
| TryLysC MShigh |
|
|---|
General Statistics
Number of major isoforms |
Number of additional isoforms |
Number of all proteins |
Number of amino acids |
Min. Seq. Length |
Max. Seq. Length |
Avg. Seq. Length |
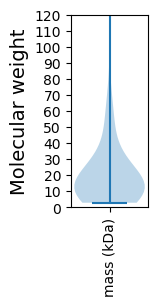
Avg. Mol. Weight |
|---|---|---|---|---|---|---|---|
0 |
14483 |
25 |
2074 |
188.1 |
21.53 |
Amino acid frequency
Ala |
Cys |
Asp |
Glu |
Phe |
Gly |
His |
Ile |
Lys |
Leu |
|---|---|---|---|---|---|---|---|---|---|
5.538 ± 0.662 | 0.532 ± 0.13 |
6.152 ± 0.238 | 7.416 ± 0.431 |
3.86 ± 0.234 | 5.986 ± 0.584 |
1.664 ± 0.136 | 7.312 ± 0.419 |
9.998 ± 0.501 | 7.906 ± 0.282 |
Met |
Asn |
Gln |
Pro |
Arg |
Ser |
Thr |
Val |
Trp |
Tyr |
|---|---|---|---|---|---|---|---|---|---|
2.7 ± 0.141 | 7.022 ± 0.285 |
2.499 ± 0.216 | 3.818 ± 0.198 |
4.053 ± 0.177 | 6.325 ± 0.352 |
5.862 ± 0.232 | 5.648 ± 0.208 |
1.215 ± 0.102 | 4.495 ± 0.387 |
Most of the basic statistics you can see at this page can be downloaded from this CSV file
See this proteome in:

Proteome-pI is available under Creative Commons Attribution-NoDerivs license, for more details see here
| Reference: Kozlowski LP. Proteome-pI 2.0: Proteome Isoelectric Point Database Update. Nucleic Acids Res. 2021, doi: 10.1093/nar/gkab944 | Contact: Lukasz P. Kozlowski |