Escherichia phage HK75
Taxonomy: Viruses; Duplodnaviria; Heunggongvirae; Uroviricota; Caudoviricetes; Caudovirales; Siphoviridae; Hendrixvirinae; Saikungvirus; Escherichia virus HK75
Average proteome isoelectric point is 7.18
Get precalculated fractions of proteins
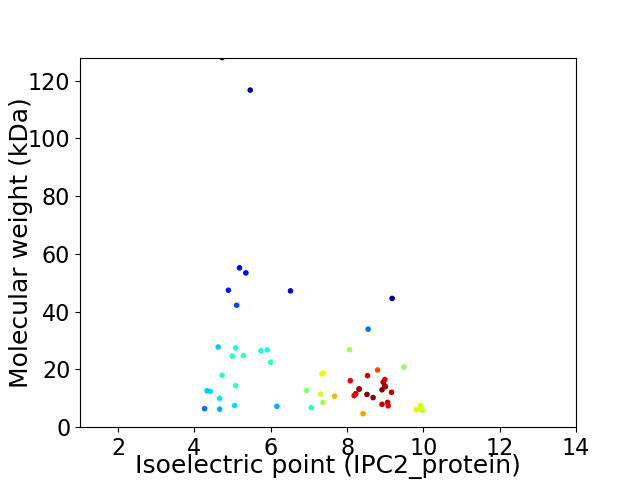
Virtual 2D-PAGE plot for 58 proteins (isoelectric point calculated using IPC2_protein)
Get csv file with sequences according to given criteria:
* You can choose from 21 different methods for calculating isoelectric point
Summary statistics related to proteome-wise predictions

Protein with the lowest isoelectric point:
>tr|G8C7M8|G8C7M8_9CAUD KilA OS=Escherichia phage HK75 OX=906668 GN=HK75_47 PE=4 SV=1
MM1 pKa = 7.82IDD3 pKa = 3.4PNRR6 pKa = 11.84SYY8 pKa = 10.61EE9 pKa = 3.97QEE11 pKa = 4.12SVEE14 pKa = 5.1RR15 pKa = 11.84ALTCANCGQKK25 pKa = 10.32LHH27 pKa = 5.86VLEE30 pKa = 4.31VHH32 pKa = 5.94VCEE35 pKa = 4.54HH36 pKa = 6.71CCAEE40 pKa = 4.99LMSDD44 pKa = 4.35PNSSMYY50 pKa = 10.6EE51 pKa = 3.98EE52 pKa = 5.0EE53 pKa = 4.99DD54 pKa = 4.39DD55 pKa = 4.1EE56 pKa = 4.75
MM1 pKa = 7.82IDD3 pKa = 3.4PNRR6 pKa = 11.84SYY8 pKa = 10.61EE9 pKa = 3.97QEE11 pKa = 4.12SVEE14 pKa = 5.1RR15 pKa = 11.84ALTCANCGQKK25 pKa = 10.32LHH27 pKa = 5.86VLEE30 pKa = 4.31VHH32 pKa = 5.94VCEE35 pKa = 4.54HH36 pKa = 6.71CCAEE40 pKa = 4.99LMSDD44 pKa = 4.35PNSSMYY50 pKa = 10.6EE51 pKa = 3.98EE52 pKa = 5.0EE53 pKa = 4.99DD54 pKa = 4.39DD55 pKa = 4.1EE56 pKa = 4.75
Molecular weight: 6.42 kDa
Isoelectric point according different methods:
Protein with the highest isoelectric point:
>tr|G8C7M2|G8C7M2_9CAUD Replication protein O OS=Escherichia phage HK75 OX=906668 GN=HK75_41 PE=4 SV=1
MM1 pKa = 6.89TKK3 pKa = 9.97RR4 pKa = 11.84RR5 pKa = 11.84KK6 pKa = 9.59KK7 pKa = 8.64YY8 pKa = 8.27QEE10 pKa = 3.91KK11 pKa = 10.86EE12 pKa = 4.34EE13 pKa = 4.08IRR15 pKa = 11.84HH16 pKa = 5.8PDD18 pKa = 3.24SPEE21 pKa = 3.86GLVVAAANNRR31 pKa = 11.84AFAEE35 pKa = 4.16RR36 pKa = 11.84LVGVYY41 pKa = 9.93RR42 pKa = 11.84LAKK45 pKa = 10.37AGVKK49 pKa = 9.75HH50 pKa = 5.82GRR52 pKa = 11.84RR53 pKa = 3.65
MM1 pKa = 6.89TKK3 pKa = 9.97RR4 pKa = 11.84RR5 pKa = 11.84KK6 pKa = 9.59KK7 pKa = 8.64YY8 pKa = 8.27QEE10 pKa = 3.91KK11 pKa = 10.86EE12 pKa = 4.34EE13 pKa = 4.08IRR15 pKa = 11.84HH16 pKa = 5.8PDD18 pKa = 3.24SPEE21 pKa = 3.86GLVVAAANNRR31 pKa = 11.84AFAEE35 pKa = 4.16RR36 pKa = 11.84LVGVYY41 pKa = 9.93RR42 pKa = 11.84LAKK45 pKa = 10.37AGVKK49 pKa = 9.75HH50 pKa = 5.82GRR52 pKa = 11.84RR53 pKa = 3.65
Molecular weight: 6.09 kDa
Isoelectric point according different methods:
Peptides (in silico digests for buttom-up proteomics)
Below you can find in silico digests of the whole proteome with Trypsin, Chymotrypsin, Trypsin+LysC, LysN, ArgC proteases suitable for different mass spec machines.| Try ESI |
 |
|---|
| ChTry ESI |
|
|---|
| ArgC ESI |
|
|---|
| LysN ESI |
|
|---|
| TryLysC ESI |
|
|---|
| Try MALDI |
|
|---|
| ChTry MALDI |
|
|---|
| ArgC MALDI |
|
|---|
| LysN MALDI |
|
|---|
| TryLysC MALDI |
|
|---|
| Try LTQ |
|
|---|
| ChTry LTQ |
|
|---|
| ArgC LTQ |
|
|---|
| LysN LTQ |
|
|---|
| TryLysC LTQ |
|
|---|
| Try MSlow |
|
|---|
| ChTry MSlow |
|
|---|
| ArgC MSlow |
|
|---|
| LysN MSlow |
|
|---|
| TryLysC MSlow |
|
|---|
| Try MShigh |
|
|---|
| ChTry MShigh |
|
|---|
| ArgC MShigh |
|
|---|
| LysN MShigh |
|
|---|
| TryLysC MShigh |
|
|---|
General Statistics
Number of major isoforms |
Number of additional isoforms |
Number of all proteins |
Number of amino acids |
Min. Seq. Length |
Max. Seq. Length |
Avg. Seq. Length |
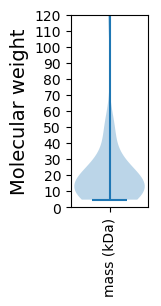
Avg. Mol. Weight |
|---|---|---|---|---|---|---|---|
0 |
11285 |
41 |
1183 |
194.6 |
21.56 |
Amino acid frequency
Ala |
Cys |
Asp |
Glu |
Phe |
Gly |
His |
Ile |
Lys |
Leu |
|---|---|---|---|---|---|---|---|---|---|
9.499 ± 0.585 | 1.081 ± 0.17 |
5.84 ± 0.264 | 5.964 ± 0.32 |
3.146 ± 0.168 | 7.568 ± 0.267 |
1.471 ± 0.243 | 5.804 ± 0.231 |
5.662 ± 0.301 | 7.745 ± 0.258 |
Met |
Asn |
Gln |
Pro |
Arg |
Ser |
Thr |
Val |
Trp |
Tyr |
|---|---|---|---|---|---|---|---|---|---|
2.774 ± 0.178 | 4.723 ± 0.228 |
3.695 ± 0.286 | 4.883 ± 0.352 |
6.114 ± 0.301 | 7.027 ± 0.338 |
5.999 ± 0.324 | 6.398 ± 0.363 |
1.755 ± 0.179 | 2.853 ± 0.166 |
Most of the basic statistics you can see at this page can be downloaded from this CSV file
See this proteome in:

Proteome-pI is available under Creative Commons Attribution-NoDerivs license, for more details see here
| Reference: Kozlowski LP. Proteome-pI 2.0: Proteome Isoelectric Point Database Update. Nucleic Acids Res. 2021, doi: 10.1093/nar/gkab944 | Contact: Lukasz P. Kozlowski |