Flavobacterium phage vB_FspS_sniff9-2
Taxonomy: Viruses; Duplodnaviria; Heunggongvirae; Uroviricota; Caudoviricetes; Caudovirales; Siphoviridae; Lillamyvirus; unclassified Lillamyvirus
Average proteome isoelectric point is 6.93
Get precalculated fractions of proteins
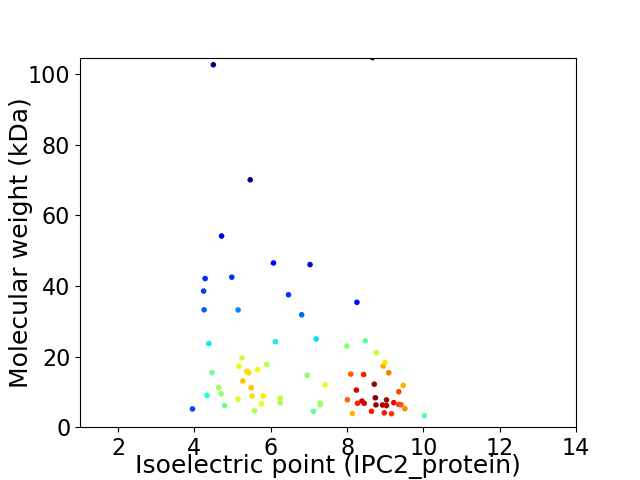
Virtual 2D-PAGE plot for 73 proteins (isoelectric point calculated using IPC2_protein)
Get csv file with sequences according to given criteria:
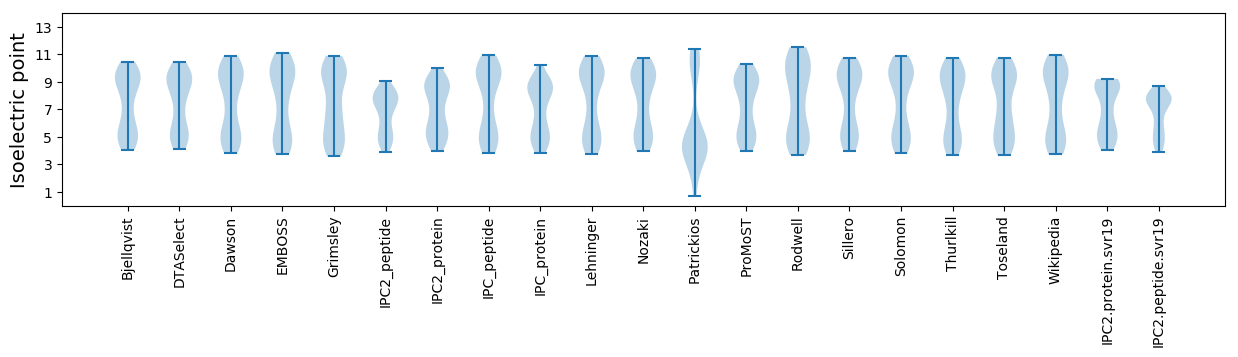
* You can choose from 21 different methods for calculating isoelectric point
Summary statistics related to proteome-wise predictions
Protein with the lowest isoelectric point:
>tr|A0A6B9LGB7|A0A6B9LGB7_9CAUD Uncharacterized protein OS=Flavobacterium phage vB_FspS_sniff9-2 OX=2686269 GN=sniff92_gp059 PE=4 SV=1
MM1 pKa = 7.13TKK3 pKa = 10.25FVIMKK8 pKa = 7.91TLKK11 pKa = 10.69LLLITALAILFLSCSNDD28 pKa = 3.34DD29 pKa = 4.75NEE31 pKa = 4.51QCTYY35 pKa = 9.76TCNAWVKK42 pKa = 10.29PDD44 pKa = 3.4GQIRR48 pKa = 11.84TVIPVEE54 pKa = 4.25LNCEE58 pKa = 4.08TNEE61 pKa = 4.67PINLPEE67 pKa = 4.47GYY69 pKa = 9.92IFLGCDD75 pKa = 3.18NDD77 pKa = 4.19NIPP80 pKa = 4.55
MM1 pKa = 7.13TKK3 pKa = 10.25FVIMKK8 pKa = 7.91TLKK11 pKa = 10.69LLLITALAILFLSCSNDD28 pKa = 3.34DD29 pKa = 4.75NEE31 pKa = 4.51QCTYY35 pKa = 9.76TCNAWVKK42 pKa = 10.29PDD44 pKa = 3.4GQIRR48 pKa = 11.84TVIPVEE54 pKa = 4.25LNCEE58 pKa = 4.08TNEE61 pKa = 4.67PINLPEE67 pKa = 4.47GYY69 pKa = 9.92IFLGCDD75 pKa = 3.18NDD77 pKa = 4.19NIPP80 pKa = 4.55
Molecular weight: 8.99 kDa
Isoelectric point according different methods:
Protein with the highest isoelectric point:
>tr|A0A6B9LT97|A0A6B9LT97_9CAUD Uncharacterized protein OS=Flavobacterium phage vB_FspS_sniff9-2 OX=2686269 GN=sniff92_gp035 PE=4 SV=1
MM1 pKa = 7.43GVGLTLSGFVSVATKK16 pKa = 10.93NKK18 pKa = 9.66TNINLNTKK26 pKa = 9.55NYY28 pKa = 10.34RR29 pKa = 11.84LL30 pKa = 3.6
MM1 pKa = 7.43GVGLTLSGFVSVATKK16 pKa = 10.93NKK18 pKa = 9.66TNINLNTKK26 pKa = 9.55NYY28 pKa = 10.34RR29 pKa = 11.84LL30 pKa = 3.6
Molecular weight: 3.25 kDa
Isoelectric point according different methods:
Peptides (in silico digests for buttom-up proteomics)
Below you can find in silico digests of the whole proteome with Trypsin, Chymotrypsin, Trypsin+LysC, LysN, ArgC proteases suitable for different mass spec machines.| Try ESI |
 |
|---|
| ChTry ESI |
|
|---|
| ArgC ESI |
|
|---|
| LysN ESI |
|
|---|
| TryLysC ESI |
|
|---|
| Try MALDI |
|
|---|
| ChTry MALDI |
|
|---|
| ArgC MALDI |
|
|---|
| LysN MALDI |
|
|---|
| TryLysC MALDI |
|
|---|
| Try LTQ |
|
|---|
| ChTry LTQ |
|
|---|
| ArgC LTQ |
|
|---|
| LysN LTQ |
|
|---|
| TryLysC LTQ |
|
|---|
| Try MSlow |
|
|---|
| ChTry MSlow |
|
|---|
| ArgC MSlow |
|
|---|
| LysN MSlow |
|
|---|
| TryLysC MSlow |
|
|---|
| Try MShigh |
|
|---|
| ChTry MShigh |
|
|---|
| ArgC MShigh |
|
|---|
| LysN MShigh |
|
|---|
| TryLysC MShigh |
|
|---|
General Statistics
Number of major isoforms |
Number of additional isoforms |
Number of all proteins |
Number of amino acids |
Min. Seq. Length |
Max. Seq. Length |
Avg. Seq. Length |
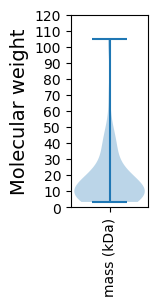
Avg. Mol. Weight |
|---|---|---|---|---|---|---|---|
0 |
11946 |
30 |
931 |
163.6 |
18.8 |
Amino acid frequency
Ala |
Cys |
Asp |
Glu |
Phe |
Gly |
His |
Ile |
Lys |
Leu |
|---|---|---|---|---|---|---|---|---|---|
4.805 ± 0.411 | 1.231 ± 0.19 |
5.516 ± 0.235 | 7.333 ± 0.252 |
5.081 ± 0.259 | 4.671 ± 0.236 |
1.331 ± 0.158 | 8.028 ± 0.3 |
9.702 ± 0.54 | 9.116 ± 0.236 |
Met |
Asn |
Gln |
Pro |
Arg |
Ser |
Thr |
Val |
Trp |
Tyr |
|---|---|---|---|---|---|---|---|---|---|
2.235 ± 0.147 | 7.986 ± 0.387 |
2.553 ± 0.176 | 4.052 ± 0.306 |
3.022 ± 0.187 | 6.328 ± 0.27 |
6.395 ± 0.357 | 5.416 ± 0.206 |
0.946 ± 0.09 | 4.252 ± 0.258 |
Most of the basic statistics you can see at this page can be downloaded from this CSV file
See this proteome in:

Proteome-pI is available under Creative Commons Attribution-NoDerivs license, for more details see here
| Reference: Kozlowski LP. Proteome-pI 2.0: Proteome Isoelectric Point Database Update. Nucleic Acids Res. 2021, doi: 10.1093/nar/gkab944 | Contact: Lukasz P. Kozlowski |