Paenibacillus phage Ash
Taxonomy: Viruses; Duplodnaviria; Heunggongvirae; Uroviricota; Caudoviricetes; Caudovirales; Siphoviridae; Halcyonevirus; unclassified Halcyonevirus
Average proteome isoelectric point is 6.27
Get precalculated fractions of proteins
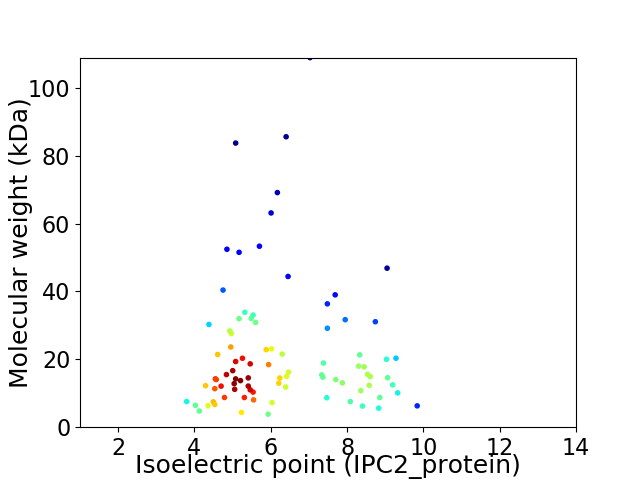
Virtual 2D-PAGE plot for 88 proteins (isoelectric point calculated using IPC2_protein)
Get csv file with sequences according to given criteria:
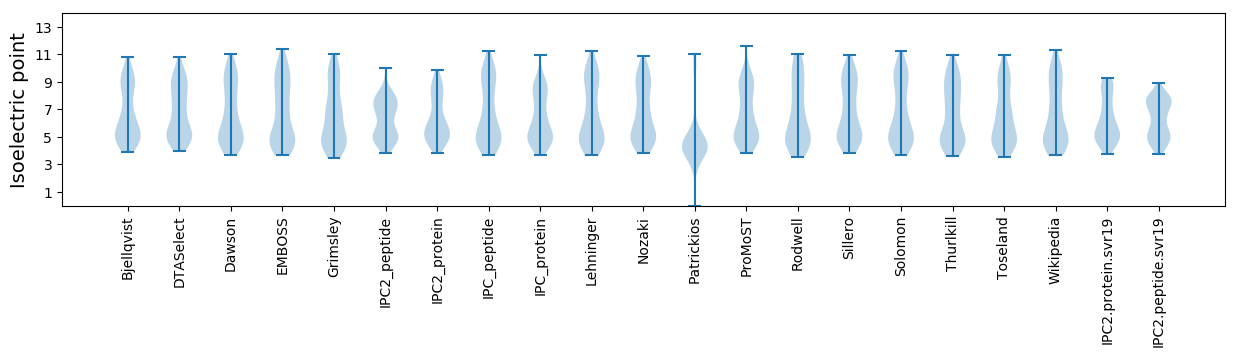
* You can choose from 21 different methods for calculating isoelectric point
Summary statistics related to proteome-wise predictions
Protein with the lowest isoelectric point:
>tr|A0A345ASU9|A0A345ASU9_9CAUD Uncharacterized protein OS=Paenibacillus phage Ash OX=2249763 GN=ASH_55 PE=4 SV=1
MM1 pKa = 7.88PEE3 pKa = 4.73LDD5 pKa = 3.53RR6 pKa = 11.84FDD8 pKa = 4.75YY9 pKa = 11.06DD10 pKa = 3.31GSEE13 pKa = 4.2PDD15 pKa = 3.8VVATCASCDD24 pKa = 3.6GEE26 pKa = 4.75VYY28 pKa = 10.71EE29 pKa = 5.47GDD31 pKa = 3.86DD32 pKa = 3.77VVLTTEE38 pKa = 4.04GDD40 pKa = 3.6IVHH43 pKa = 6.53EE44 pKa = 4.26EE45 pKa = 4.11CFAAFARR52 pKa = 11.84EE53 pKa = 3.83IYY55 pKa = 10.28RR56 pKa = 11.84NVSGTIDD63 pKa = 3.32ANGRR67 pKa = 11.84III69 pKa = 4.67
MM1 pKa = 7.88PEE3 pKa = 4.73LDD5 pKa = 3.53RR6 pKa = 11.84FDD8 pKa = 4.75YY9 pKa = 11.06DD10 pKa = 3.31GSEE13 pKa = 4.2PDD15 pKa = 3.8VVATCASCDD24 pKa = 3.6GEE26 pKa = 4.75VYY28 pKa = 10.71EE29 pKa = 5.47GDD31 pKa = 3.86DD32 pKa = 3.77VVLTTEE38 pKa = 4.04GDD40 pKa = 3.6IVHH43 pKa = 6.53EE44 pKa = 4.26EE45 pKa = 4.11CFAAFARR52 pKa = 11.84EE53 pKa = 3.83IYY55 pKa = 10.28RR56 pKa = 11.84NVSGTIDD63 pKa = 3.32ANGRR67 pKa = 11.84III69 pKa = 4.67
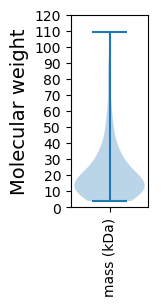
Molecular weight: 7.56 kDa
Isoelectric point according different methods:
Protein with the highest isoelectric point:
>tr|A0A345ASP7|A0A345ASP7_9CAUD Terminase large subunit OS=Paenibacillus phage Ash OX=2249763 GN=ASH_3 PE=4 SV=1
MM1 pKa = 7.54SKK3 pKa = 11.05LEE5 pKa = 3.91VAASVLIGIFIIAFAAVLIFAIRR28 pKa = 11.84TAGLSPADD36 pKa = 3.68TALLITVYY44 pKa = 11.21ALTILSAIRR53 pKa = 11.84GLRR56 pKa = 11.84WLRR59 pKa = 3.61
MM1 pKa = 7.54SKK3 pKa = 11.05LEE5 pKa = 3.91VAASVLIGIFIIAFAAVLIFAIRR28 pKa = 11.84TAGLSPADD36 pKa = 3.68TALLITVYY44 pKa = 11.21ALTILSAIRR53 pKa = 11.84GLRR56 pKa = 11.84WLRR59 pKa = 3.61
Molecular weight: 6.29 kDa
Isoelectric point according different methods:
Peptides (in silico digests for buttom-up proteomics)
Below you can find in silico digests of the whole proteome with Trypsin, Chymotrypsin, Trypsin+LysC, LysN, ArgC proteases suitable for different mass spec machines.| Try ESI |
 |
|---|
| ChTry ESI |
|
|---|
| ArgC ESI |
|
|---|
| LysN ESI |
|
|---|
| TryLysC ESI |
|
|---|
| Try MALDI |
|
|---|
| ChTry MALDI |
|
|---|
| ArgC MALDI |
|
|---|
| LysN MALDI |
|
|---|
| TryLysC MALDI |
|
|---|
| Try LTQ |
|
|---|
| ChTry LTQ |
|
|---|
| ArgC LTQ |
|
|---|
| LysN LTQ |
|
|---|
| TryLysC LTQ |
|
|---|
| Try MSlow |
|
|---|
| ChTry MSlow |
|
|---|
| ArgC MSlow |
|
|---|
| LysN MSlow |
|
|---|
| TryLysC MSlow |
|
|---|
| Try MShigh |
|
|---|
| ChTry MShigh |
|
|---|
| ArgC MShigh |
|
|---|
| LysN MShigh |
|
|---|
| TryLysC MShigh |
|
|---|
General Statistics
Number of major isoforms |
Number of additional isoforms |
Number of all proteins |
Number of amino acids |
Min. Seq. Length |
Max. Seq. Length |
Avg. Seq. Length |
Avg. Mol. Weight |
|---|---|---|---|---|---|---|---|
0 |
17233 |
37 |
991 |
195.8 |
22.25 |
Amino acid frequency
Ala |
Cys |
Asp |
Glu |
Phe |
Gly |
His |
Ile |
Lys |
Leu |
|---|---|---|---|---|---|---|---|---|---|
7.985 ± 0.248 | 0.992 ± 0.114 |
6.737 ± 0.2 | 8.188 ± 0.346 |
3.592 ± 0.169 | 6.696 ± 0.316 |
1.706 ± 0.114 | 6.435 ± 0.172 |
7.207 ± 0.392 | 8.211 ± 0.21 |
Met |
Asn |
Gln |
Pro |
Arg |
Ser |
Thr |
Val |
Trp |
Tyr |
|---|---|---|---|---|---|---|---|---|---|
2.466 ± 0.121 | 3.859 ± 0.196 |
3.557 ± 0.188 | 3.041 ± 0.179 |
6.499 ± 0.303 | 5.13 ± 0.187 |
5.397 ± 0.186 | 6.58 ± 0.261 |
1.393 ± 0.127 | 4.329 ± 0.21 |
Most of the basic statistics you can see at this page can be downloaded from this CSV file
See this proteome in:

Proteome-pI is available under Creative Commons Attribution-NoDerivs license, for more details see here
| Reference: Kozlowski LP. Proteome-pI 2.0: Proteome Isoelectric Point Database Update. Nucleic Acids Res. 2021, doi: 10.1093/nar/gkab944 | Contact: Lukasz P. Kozlowski |