Schistosoma mansoni (Blood fluke)
Taxonomy: cellular organisms; Eukaryota; Opisthokonta; Metazoa; Eumetazoa; Bilateria; Protostomia; Spiralia; Lophotrochozoa; Platyhelminthes; Trematoda; Digenea; Strigeidida; Schistosomatoidea; Schistosomatidae; Schistosoma
Average proteome isoelectric point is 6.74
Get precalculated fractions of proteins
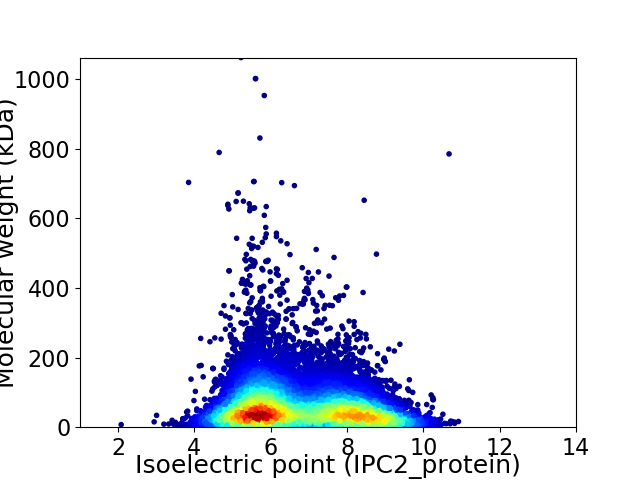
Virtual 2D-PAGE plot for 14182 proteins (isoelectric point calculated using IPC2_protein)
Get csv file with sequences according to given criteria:
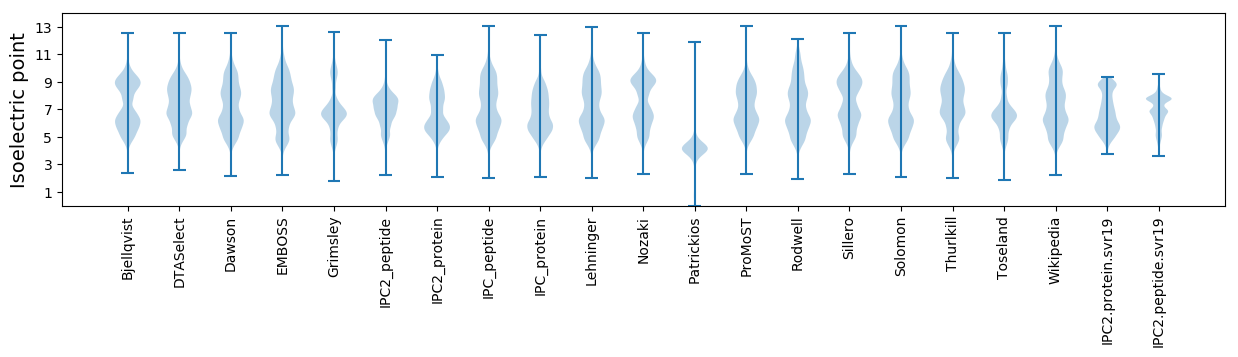
* You can choose from 21 different methods for calculating isoelectric point
Summary statistics related to proteome-wise predictions
Protein with the lowest isoelectric point:
>tr|A0A3Q0KNZ1|A0A3Q0KNZ1_SCHMA Amino acid transporter OS=Schistosoma mansoni OX=6183 PE=4 SV=1
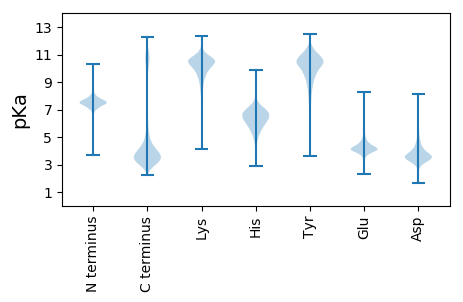
MM1 pKa = 7.7LIIVIISSIVYY12 pKa = 9.0INCIVISNNGSYY24 pKa = 10.1QFQSQKK30 pKa = 7.56QTFNANGYY38 pKa = 10.1SMHH41 pKa = 6.57EE42 pKa = 4.2QNQSQSFIHH51 pKa = 6.16NNNDD55 pKa = 3.25GQHH58 pKa = 6.95IIQKK62 pKa = 9.85QSQQQSQHH70 pKa = 6.15SYY72 pKa = 10.5SIQSQIQYY80 pKa = 10.76QSLNYY85 pKa = 9.92TNLQSLVNPQNQNDD99 pKa = 3.94DD100 pKa = 3.5SQIPVDD106 pKa = 3.83TTNQSSGSQISNQAEE121 pKa = 4.33SPSQSGTDD129 pKa = 3.63IDD131 pKa = 4.75PSLPDD136 pKa = 3.14NHH138 pKa = 6.06QQQQQATEE146 pKa = 4.51LPQEE150 pKa = 4.52SQDD153 pKa = 3.74SQQQQQQQQPTQEE166 pKa = 4.32TQNEE170 pKa = 4.15ADD172 pKa = 3.9SPHH175 pKa = 7.2LEE177 pKa = 4.53LSPQFDD183 pKa = 3.3QSHH186 pKa = 6.58SNNSNSILVQPQSSEE201 pKa = 3.91QSQEE205 pKa = 3.88LQDD208 pKa = 4.21NQDD211 pKa = 2.95QSSQQLQSEE220 pKa = 4.54IQQPHH225 pKa = 5.71QLDD228 pKa = 4.46LSPQFDD234 pKa = 3.43QSQSNISDD242 pKa = 5.04LILVQLNSSKK252 pKa = 10.26QSRR255 pKa = 11.84EE256 pKa = 3.59IQDD259 pKa = 3.69NQDD262 pKa = 2.73QSLPQLQPEE271 pKa = 4.5IQQPHH276 pKa = 6.1QIDD279 pKa = 4.06LSSQFDD285 pKa = 3.5QSQSNISDD293 pKa = 5.04LILVQLNSSKK303 pKa = 10.26QSRR306 pKa = 11.84EE307 pKa = 3.72IQDD310 pKa = 3.76SLNQSLPQLQPEE322 pKa = 4.5IQQPHH327 pKa = 6.1QIDD330 pKa = 4.06LSSQFDD336 pKa = 3.5QSQSNISDD344 pKa = 5.1LILVQPQPPGQFQEE358 pKa = 4.24SDD360 pKa = 3.61SQILNVSKK368 pKa = 10.46PVVEE372 pKa = 4.97SYY374 pKa = 11.39SEE376 pKa = 4.13FDD378 pKa = 3.75DD379 pKa = 4.35SQTGEE384 pKa = 4.12PKK386 pKa = 10.26QSLEE390 pKa = 4.08AQLTPDD396 pKa = 4.54PPLSYY401 pKa = 10.9QNSNNNNDD409 pKa = 3.1
MM1 pKa = 7.7LIIVIISSIVYY12 pKa = 9.0INCIVISNNGSYY24 pKa = 10.1QFQSQKK30 pKa = 7.56QTFNANGYY38 pKa = 10.1SMHH41 pKa = 6.57EE42 pKa = 4.2QNQSQSFIHH51 pKa = 6.16NNNDD55 pKa = 3.25GQHH58 pKa = 6.95IIQKK62 pKa = 9.85QSQQQSQHH70 pKa = 6.15SYY72 pKa = 10.5SIQSQIQYY80 pKa = 10.76QSLNYY85 pKa = 9.92TNLQSLVNPQNQNDD99 pKa = 3.94DD100 pKa = 3.5SQIPVDD106 pKa = 3.83TTNQSSGSQISNQAEE121 pKa = 4.33SPSQSGTDD129 pKa = 3.63IDD131 pKa = 4.75PSLPDD136 pKa = 3.14NHH138 pKa = 6.06QQQQQATEE146 pKa = 4.51LPQEE150 pKa = 4.52SQDD153 pKa = 3.74SQQQQQQQQPTQEE166 pKa = 4.32TQNEE170 pKa = 4.15ADD172 pKa = 3.9SPHH175 pKa = 7.2LEE177 pKa = 4.53LSPQFDD183 pKa = 3.3QSHH186 pKa = 6.58SNNSNSILVQPQSSEE201 pKa = 3.91QSQEE205 pKa = 3.88LQDD208 pKa = 4.21NQDD211 pKa = 2.95QSSQQLQSEE220 pKa = 4.54IQQPHH225 pKa = 5.71QLDD228 pKa = 4.46LSPQFDD234 pKa = 3.43QSQSNISDD242 pKa = 5.04LILVQLNSSKK252 pKa = 10.26QSRR255 pKa = 11.84EE256 pKa = 3.59IQDD259 pKa = 3.69NQDD262 pKa = 2.73QSLPQLQPEE271 pKa = 4.5IQQPHH276 pKa = 6.1QIDD279 pKa = 4.06LSSQFDD285 pKa = 3.5QSQSNISDD293 pKa = 5.04LILVQLNSSKK303 pKa = 10.26QSRR306 pKa = 11.84EE307 pKa = 3.72IQDD310 pKa = 3.76SLNQSLPQLQPEE322 pKa = 4.5IQQPHH327 pKa = 6.1QIDD330 pKa = 4.06LSSQFDD336 pKa = 3.5QSQSNISDD344 pKa = 5.1LILVQPQPPGQFQEE358 pKa = 4.24SDD360 pKa = 3.61SQILNVSKK368 pKa = 10.46PVVEE372 pKa = 4.97SYY374 pKa = 11.39SEE376 pKa = 4.13FDD378 pKa = 3.75DD379 pKa = 4.35SQTGEE384 pKa = 4.12PKK386 pKa = 10.26QSLEE390 pKa = 4.08AQLTPDD396 pKa = 4.54PPLSYY401 pKa = 10.9QNSNNNNDD409 pKa = 3.1
Molecular weight: 46.13 kDa
Isoelectric point according different methods:
Protein with the highest isoelectric point:
>tr|A0A5K4FAB1|A0A5K4FAB1_SCHMA Uncharacterized protein OS=Schistosoma mansoni OX=6183 PE=4 SV=1
MM1 pKa = 7.6KK2 pKa = 10.08CQEE5 pKa = 3.82NTKK8 pKa = 9.74PKK10 pKa = 10.27IYY12 pKa = 10.23IFTNATRR19 pKa = 11.84LMSQSSLQQRR29 pKa = 11.84SRR31 pKa = 11.84PQMSQSSLQQRR42 pKa = 11.84SRR44 pKa = 11.84SQMSQSSLQQRR55 pKa = 11.84SRR57 pKa = 11.84PQMSQSSLQQRR68 pKa = 11.84SRR70 pKa = 11.84SQMSQSSLQQRR81 pKa = 11.84SRR83 pKa = 11.84PQMSQSSLQQRR94 pKa = 11.84SRR96 pKa = 11.84SQMSQSSLQQRR107 pKa = 11.84SRR109 pKa = 11.84PQMSQSSLQQRR120 pKa = 11.84SRR122 pKa = 11.84SQMSQSSLQQRR133 pKa = 11.84SRR135 pKa = 11.84PQMSQSS141 pKa = 3.05
MM1 pKa = 7.6KK2 pKa = 10.08CQEE5 pKa = 3.82NTKK8 pKa = 9.74PKK10 pKa = 10.27IYY12 pKa = 10.23IFTNATRR19 pKa = 11.84LMSQSSLQQRR29 pKa = 11.84SRR31 pKa = 11.84PQMSQSSLQQRR42 pKa = 11.84SRR44 pKa = 11.84SQMSQSSLQQRR55 pKa = 11.84SRR57 pKa = 11.84PQMSQSSLQQRR68 pKa = 11.84SRR70 pKa = 11.84SQMSQSSLQQRR81 pKa = 11.84SRR83 pKa = 11.84PQMSQSSLQQRR94 pKa = 11.84SRR96 pKa = 11.84SQMSQSSLQQRR107 pKa = 11.84SRR109 pKa = 11.84PQMSQSSLQQRR120 pKa = 11.84SRR122 pKa = 11.84SQMSQSSLQQRR133 pKa = 11.84SRR135 pKa = 11.84PQMSQSS141 pKa = 3.05
Molecular weight: 16.43 kDa
Isoelectric point according different methods:
Peptides (in silico digests for buttom-up proteomics)
Below you can find in silico digests of the whole proteome with Trypsin, Chymotrypsin, Trypsin+LysC, LysN, ArgC proteases suitable for different mass spec machines.| Try ESI |
 |
|---|
| ChTry ESI |
|
|---|
| ArgC ESI |
|
|---|
| LysN ESI |
|
|---|
| TryLysC ESI |
|
|---|
| Try MALDI |
|
|---|
| ChTry MALDI |
|
|---|
| ArgC MALDI |
|
|---|
| LysN MALDI |
|
|---|
| TryLysC MALDI |
|
|---|
| Try LTQ |
|
|---|
| ChTry LTQ |
|
|---|
| ArgC LTQ |
|
|---|
| LysN LTQ |
|
|---|
| TryLysC LTQ |
|
|---|
| Try MSlow |
|
|---|
| ChTry MSlow |
|
|---|
| ArgC MSlow |
|
|---|
| LysN MSlow |
|
|---|
| TryLysC MSlow |
|
|---|
| Try MShigh |
|
|---|
| ChTry MShigh |
|
|---|
| ArgC MShigh |
|
|---|
| LysN MShigh |
|
|---|
| TryLysC MShigh |
|
|---|
General Statistics
Number of major isoforms |
Number of additional isoforms |
Number of all proteins |
Number of amino acids |
Min. Seq. Length |
Max. Seq. Length |
Avg. Seq. Length |
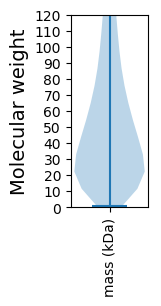
Avg. Mol. Weight |
|---|---|---|---|---|---|---|---|
8463562 |
6 |
9226 |
596.8 |
67.44 |
Amino acid frequency
Ala |
Cys |
Asp |
Glu |
Phe |
Gly |
His |
Ile |
Lys |
Leu |
|---|---|---|---|---|---|---|---|---|---|
4.468 ± 0.019 | 2.142 ± 0.013 |
5.297 ± 0.015 | 5.581 ± 0.029 |
3.803 ± 0.014 | 4.388 ± 0.029 |
2.896 ± 0.012 | 6.618 ± 0.024 |
5.643 ± 0.021 | 9.697 ± 0.024 |
Met |
Asn |
Gln |
Pro |
Arg |
Ser |
Thr |
Val |
Trp |
Tyr |
|---|---|---|---|---|---|---|---|---|---|
1.965 ± 0.007 | 7.228 ± 0.033 |
4.645 ± 0.024 | 4.356 ± 0.015 |
4.84 ± 0.016 | 10.338 ± 0.037 |
6.492 ± 0.03 | 5.326 ± 0.021 |
0.984 ± 0.005 | 3.291 ± 0.011 |
Most of the basic statistics you can see at this page can be downloaded from this CSV file
See this proteome in:

Proteome-pI is available under Creative Commons Attribution-NoDerivs license, for more details see here
| Reference: Kozlowski LP. Proteome-pI 2.0: Proteome Isoelectric Point Database Update. Nucleic Acids Res. 2021, doi: 10.1093/nar/gkab944 | Contact: Lukasz P. Kozlowski |