Moraxella phage Mcat9
Taxonomy: Viruses; Duplodnaviria; Heunggongvirae; Uroviricota; Caudoviricetes; Caudovirales; Siphoviridae; unclassified Siphoviridae
Average proteome isoelectric point is 6.67
Get precalculated fractions of proteins
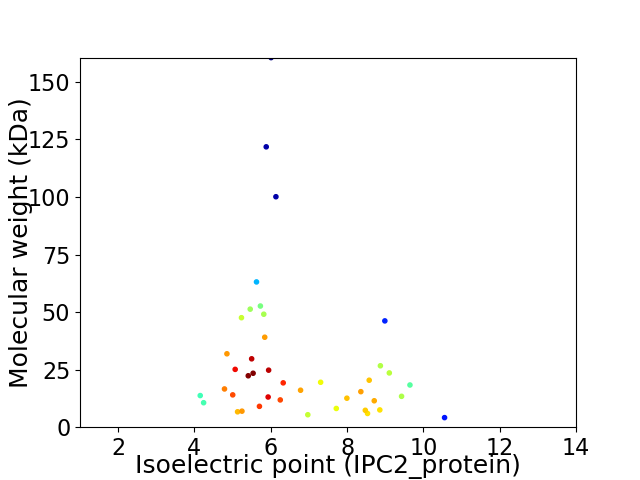
Virtual 2D-PAGE plot for 42 proteins (isoelectric point calculated using IPC2_protein)
Get csv file with sequences according to given criteria:
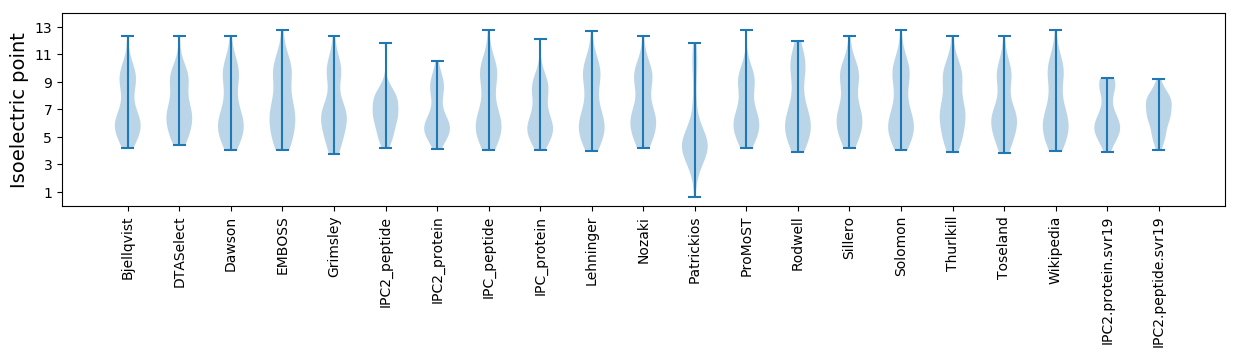
* You can choose from 21 different methods for calculating isoelectric point
Summary statistics related to proteome-wise predictions
Protein with the lowest isoelectric point:
>tr|A0A0R6PHN8|A0A0R6PHN8_9CAUD Uncharacterized protein OS=Moraxella phage Mcat9 OX=1647555 PE=4 SV=1
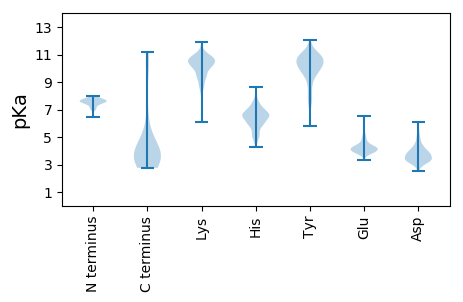
MM1 pKa = 7.1NASEE5 pKa = 5.54IIYY8 pKa = 8.19QTLSQIVDD16 pKa = 3.55GKK18 pKa = 10.85VYY20 pKa = 10.26PLLVPEE26 pKa = 4.74SDD28 pKa = 3.96SLSVPYY34 pKa = 10.24LVYY37 pKa = 10.33TPVSSVPVQTLDD49 pKa = 4.75GISGDD54 pKa = 2.92EE55 pKa = 4.05WVRR58 pKa = 11.84VQIDD62 pKa = 4.16IYY64 pKa = 11.03HH65 pKa = 6.55SDD67 pKa = 3.76YY68 pKa = 11.63DD69 pKa = 4.12VLLSLYY75 pKa = 9.67NQVISALQNKK85 pKa = 9.46ISLKK89 pKa = 10.69VFGTSNQSVDD99 pKa = 3.41DD100 pKa = 3.82GLYY103 pKa = 10.91RR104 pKa = 11.84MMFEE108 pKa = 4.81CEE110 pKa = 3.87FWSKK114 pKa = 10.6NQILPTAPP122 pKa = 3.3
MM1 pKa = 7.1NASEE5 pKa = 5.54IIYY8 pKa = 8.19QTLSQIVDD16 pKa = 3.55GKK18 pKa = 10.85VYY20 pKa = 10.26PLLVPEE26 pKa = 4.74SDD28 pKa = 3.96SLSVPYY34 pKa = 10.24LVYY37 pKa = 10.33TPVSSVPVQTLDD49 pKa = 4.75GISGDD54 pKa = 2.92EE55 pKa = 4.05WVRR58 pKa = 11.84VQIDD62 pKa = 4.16IYY64 pKa = 11.03HH65 pKa = 6.55SDD67 pKa = 3.76YY68 pKa = 11.63DD69 pKa = 4.12VLLSLYY75 pKa = 9.67NQVISALQNKK85 pKa = 9.46ISLKK89 pKa = 10.69VFGTSNQSVDD99 pKa = 3.41DD100 pKa = 3.82GLYY103 pKa = 10.91RR104 pKa = 11.84MMFEE108 pKa = 4.81CEE110 pKa = 3.87FWSKK114 pKa = 10.6NQILPTAPP122 pKa = 3.3
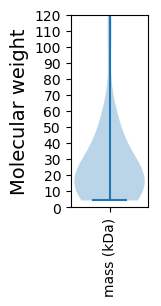
Molecular weight: 13.74 kDa
Isoelectric point according different methods:
Protein with the highest isoelectric point:
>tr|A0A0R6PHR7|A0A0R6PHR7_9CAUD Uncharacterized protein OS=Moraxella phage Mcat9 OX=1647555 PE=4 SV=1
MM1 pKa = 7.45AVLAGKK7 pKa = 10.15QITQQRR13 pKa = 11.84FVTVTTPRR21 pKa = 11.84TTTTTIAPINSGFRR35 pKa = 11.84LVAAA39 pKa = 5.31
MM1 pKa = 7.45AVLAGKK7 pKa = 10.15QITQQRR13 pKa = 11.84FVTVTTPRR21 pKa = 11.84TTTTTIAPINSGFRR35 pKa = 11.84LVAAA39 pKa = 5.31
Molecular weight: 4.16 kDa
Isoelectric point according different methods:
Peptides (in silico digests for buttom-up proteomics)
Below you can find in silico digests of the whole proteome with Trypsin, Chymotrypsin, Trypsin+LysC, LysN, ArgC proteases suitable for different mass spec machines.| Try ESI |
 |
|---|
| ChTry ESI |
|
|---|
| ArgC ESI |
|
|---|
| LysN ESI |
|
|---|
| TryLysC ESI |
|
|---|
| Try MALDI |
|
|---|
| ChTry MALDI |
|
|---|
| ArgC MALDI |
|
|---|
| LysN MALDI |
|
|---|
| TryLysC MALDI |
|
|---|
| Try LTQ |
|
|---|
| ChTry LTQ |
|
|---|
| ArgC LTQ |
|
|---|
| LysN LTQ |
|
|---|
| TryLysC LTQ |
|
|---|
| Try MSlow |
|
|---|
| ChTry MSlow |
|
|---|
| ArgC MSlow |
|
|---|
| LysN MSlow |
|
|---|
| TryLysC MSlow |
|
|---|
| Try MShigh |
|
|---|
| ChTry MShigh |
|
|---|
| ArgC MShigh |
|
|---|
| LysN MShigh |
|
|---|
| TryLysC MShigh |
|
|---|
General Statistics
Number of major isoforms |
Number of additional isoforms |
Number of all proteins |
Number of amino acids |
Min. Seq. Length |
Max. Seq. Length |
Avg. Seq. Length |
Avg. Mol. Weight |
|---|---|---|---|---|---|---|---|
0 |
11041 |
39 |
1474 |
262.9 |
29.21 |
Amino acid frequency
Ala |
Cys |
Asp |
Glu |
Phe |
Gly |
His |
Ile |
Lys |
Leu |
|---|---|---|---|---|---|---|---|---|---|
8.967 ± 0.686 | 0.879 ± 0.172 |
6.44 ± 0.291 | 5.126 ± 0.285 |
3.505 ± 0.235 | 6.684 ± 0.323 |
2.246 ± 0.273 | 6.757 ± 0.235 |
6.594 ± 0.37 | 8.704 ± 0.338 |
Met |
Asn |
Gln |
Pro |
Arg |
Ser |
Thr |
Val |
Trp |
Tyr |
|---|---|---|---|---|---|---|---|---|---|
2.464 ± 0.329 | 5.072 ± 0.327 |
3.478 ± 0.323 | 4.864 ± 0.318 |
4.601 ± 0.269 | 6.376 ± 0.415 |
6.702 ± 0.467 | 6.086 ± 0.272 |
1.196 ± 0.114 | 3.261 ± 0.23 |
Most of the basic statistics you can see at this page can be downloaded from this CSV file
See this proteome in:

Proteome-pI is available under Creative Commons Attribution-NoDerivs license, for more details see here
| Reference: Kozlowski LP. Proteome-pI 2.0: Proteome Isoelectric Point Database Update. Nucleic Acids Res. 2021, doi: 10.1093/nar/gkab944 | Contact: Lukasz P. Kozlowski |