Aeromicrobium sp. A1-2
Taxonomy: cellular organisms; Bacteria; Terrabacteria group; Actinobacteria; Actinomycetia; Propionibacteriales; Nocardioidaceae; Aeromicrobium; unclassified Aeromicrobium
Average proteome isoelectric point is 6.0
Get precalculated fractions of proteins
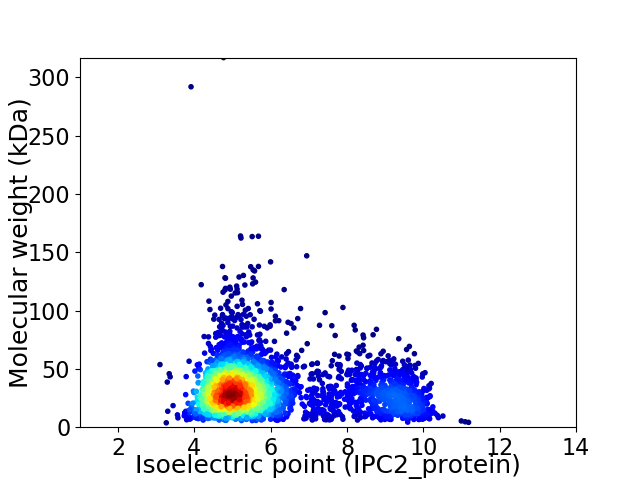
Virtual 2D-PAGE plot for 3244 proteins (isoelectric point calculated using IPC2_protein)
Get csv file with sequences according to given criteria:
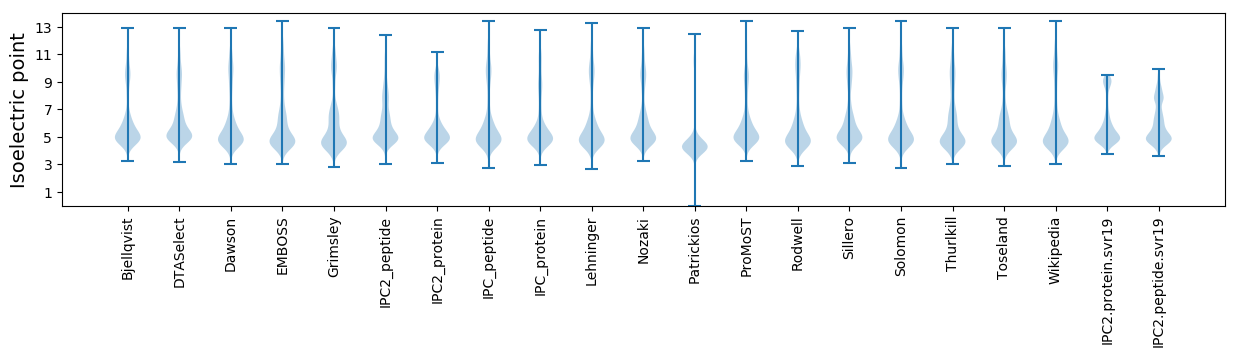
* You can choose from 21 different methods for calculating isoelectric point
Summary statistics related to proteome-wise predictions
Protein with the lowest isoelectric point:
>tr|A0A3B7DDU8|A0A3B7DDU8_9ACTN Acetyl-CoA carboxyl transferase OS=Aeromicrobium sp. A1-2 OX=2107713 GN=C6I20_13365 PE=4 SV=1
MM1 pKa = 7.31KK2 pKa = 10.12RR3 pKa = 11.84WEE5 pKa = 4.14CQQCGFIYY13 pKa = 10.57DD14 pKa = 3.86EE15 pKa = 4.62AEE17 pKa = 3.8GWEE20 pKa = 4.39EE21 pKa = 3.67EE22 pKa = 4.94DD23 pKa = 4.39IAPGTKK29 pKa = 9.05WEE31 pKa = 5.71DD32 pKa = 3.45IPDD35 pKa = 3.75DD36 pKa = 4.13WTCPDD41 pKa = 4.16CGAAKK46 pKa = 10.49ADD48 pKa = 3.67FTMLEE53 pKa = 4.35LVV55 pKa = 3.74
MM1 pKa = 7.31KK2 pKa = 10.12RR3 pKa = 11.84WEE5 pKa = 4.14CQQCGFIYY13 pKa = 10.57DD14 pKa = 3.86EE15 pKa = 4.62AEE17 pKa = 3.8GWEE20 pKa = 4.39EE21 pKa = 3.67EE22 pKa = 4.94DD23 pKa = 4.39IAPGTKK29 pKa = 9.05WEE31 pKa = 5.71DD32 pKa = 3.45IPDD35 pKa = 3.75DD36 pKa = 4.13WTCPDD41 pKa = 4.16CGAAKK46 pKa = 10.49ADD48 pKa = 3.67FTMLEE53 pKa = 4.35LVV55 pKa = 3.74
Molecular weight: 6.37 kDa
Isoelectric point according different methods:
Protein with the highest isoelectric point:
>tr|A0A3B7D0X9|A0A3B7D0X9_9ACTN Phosphoglucosamine mutase OS=Aeromicrobium sp. A1-2 OX=2107713 GN=glmM PE=3 SV=1
MM1 pKa = 7.4GSVIKK6 pKa = 10.38KK7 pKa = 8.42RR8 pKa = 11.84RR9 pKa = 11.84KK10 pKa = 9.06RR11 pKa = 11.84MSKK14 pKa = 9.63KK15 pKa = 9.56KK16 pKa = 9.27HH17 pKa = 5.36RR18 pKa = 11.84KK19 pKa = 5.5MLKK22 pKa = 7.41RR23 pKa = 11.84TRR25 pKa = 11.84VQRR28 pKa = 11.84RR29 pKa = 11.84RR30 pKa = 11.84LGKK33 pKa = 10.04
MM1 pKa = 7.4GSVIKK6 pKa = 10.38KK7 pKa = 8.42RR8 pKa = 11.84RR9 pKa = 11.84KK10 pKa = 9.06RR11 pKa = 11.84MSKK14 pKa = 9.63KK15 pKa = 9.56KK16 pKa = 9.27HH17 pKa = 5.36RR18 pKa = 11.84KK19 pKa = 5.5MLKK22 pKa = 7.41RR23 pKa = 11.84TRR25 pKa = 11.84VQRR28 pKa = 11.84RR29 pKa = 11.84RR30 pKa = 11.84LGKK33 pKa = 10.04
Molecular weight: 4.16 kDa
Isoelectric point according different methods:
Peptides (in silico digests for buttom-up proteomics)
Below you can find in silico digests of the whole proteome with Trypsin, Chymotrypsin, Trypsin+LysC, LysN, ArgC proteases suitable for different mass spec machines.| Try ESI |
 |
|---|
| ChTry ESI |
|
|---|
| ArgC ESI |
|
|---|
| LysN ESI |
|
|---|
| TryLysC ESI |
|
|---|
| Try MALDI |
|
|---|
| ChTry MALDI |
|
|---|
| ArgC MALDI |
|
|---|
| LysN MALDI |
|
|---|
| TryLysC MALDI |
|
|---|
| Try LTQ |
|
|---|
| ChTry LTQ |
|
|---|
| ArgC LTQ |
|
|---|
| LysN LTQ |
|
|---|
| TryLysC LTQ |
|
|---|
| Try MSlow |
|
|---|
| ChTry MSlow |
|
|---|
| ArgC MSlow |
|
|---|
| LysN MSlow |
|
|---|
| TryLysC MSlow |
|
|---|
| Try MShigh |
|
|---|
| ChTry MShigh |
|
|---|
| ArgC MShigh |
|
|---|
| LysN MShigh |
|
|---|
| TryLysC MShigh |
|
|---|
General Statistics
Number of major isoforms |
Number of additional isoforms |
Number of all proteins |
Number of amino acids |
Min. Seq. Length |
Max. Seq. Length |
Avg. Seq. Length |
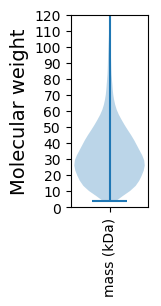
Avg. Mol. Weight |
|---|---|---|---|---|---|---|---|
0 |
1042278 |
33 |
3016 |
321.3 |
34.48 |
Amino acid frequency
Ala |
Cys |
Asp |
Glu |
Phe |
Gly |
His |
Ile |
Lys |
Leu |
|---|---|---|---|---|---|---|---|---|---|
12.499 ± 0.06 | 0.694 ± 0.011 |
6.485 ± 0.038 | 5.537 ± 0.044 |
3.033 ± 0.025 | 8.961 ± 0.037 |
2.197 ± 0.022 | 4.574 ± 0.033 |
2.412 ± 0.035 | 9.984 ± 0.05 |
Met |
Asn |
Gln |
Pro |
Arg |
Ser |
Thr |
Val |
Trp |
Tyr |
|---|---|---|---|---|---|---|---|---|---|
2.024 ± 0.017 | 2.004 ± 0.021 |
5.154 ± 0.033 | 2.909 ± 0.019 |
7.101 ± 0.045 | 5.885 ± 0.031 |
6.198 ± 0.037 | 8.945 ± 0.035 |
1.432 ± 0.019 | 1.971 ± 0.02 |
Most of the basic statistics you can see at this page can be downloaded from this CSV file
See this proteome in:

Proteome-pI is available under Creative Commons Attribution-NoDerivs license, for more details see here
| Reference: Kozlowski LP. Proteome-pI 2.0: Proteome Isoelectric Point Database Update. Nucleic Acids Res. 2021, doi: 10.1093/nar/gkab944 | Contact: Lukasz P. Kozlowski |