Pedobacter sp. PACM 27299
Taxonomy: cellular organisms; Bacteria; FCB group; Bacteroidetes/Chlorobi group; Bacteroidetes; Sphingobacteriia; Sphingobacteriales; Sphingobacteriaceae; Pedobacter; unclassified Pedobacter
Average proteome isoelectric point is 6.89
Get precalculated fractions of proteins
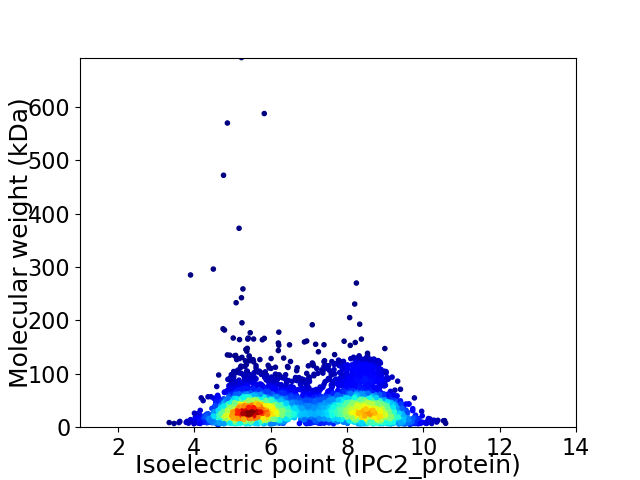
Virtual 2D-PAGE plot for 4966 proteins (isoelectric point calculated using IPC2_protein)
Get csv file with sequences according to given criteria:
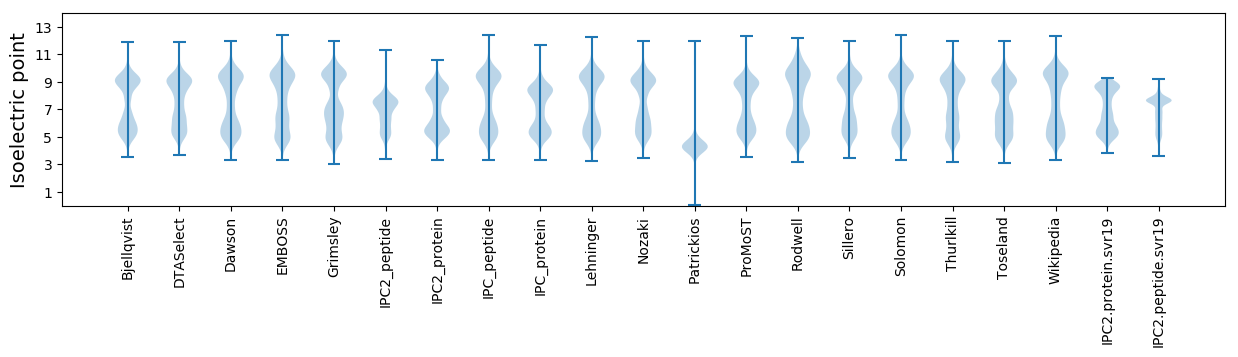
* You can choose from 21 different methods for calculating isoelectric point
Summary statistics related to proteome-wise predictions
Protein with the lowest isoelectric point:
>tr|A0A0P0NEP0|A0A0P0NEP0_9SPHI Anti-anti-sigma factor OS=Pedobacter sp. PACM 27299 OX=1727164 GN=AQ505_09200 PE=4 SV=1
MM1 pKa = 7.51NNLNHH6 pKa = 6.64LPSAAANANPKK17 pKa = 9.57EE18 pKa = 4.28EE19 pKa = 4.42NVNEE23 pKa = 4.13QPDD26 pKa = 3.74GHH28 pKa = 6.93MGMSPLIEE36 pKa = 4.24NFSLSNYY43 pKa = 9.74EE44 pKa = 5.57DD45 pKa = 5.58DD46 pKa = 5.98DD47 pKa = 5.71DD48 pKa = 6.85DD49 pKa = 6.25SGFSCPCCLPRR60 pKa = 6.09
MM1 pKa = 7.51NNLNHH6 pKa = 6.64LPSAAANANPKK17 pKa = 9.57EE18 pKa = 4.28EE19 pKa = 4.42NVNEE23 pKa = 4.13QPDD26 pKa = 3.74GHH28 pKa = 6.93MGMSPLIEE36 pKa = 4.24NFSLSNYY43 pKa = 9.74EE44 pKa = 5.57DD45 pKa = 5.58DD46 pKa = 5.98DD47 pKa = 5.71DD48 pKa = 6.85DD49 pKa = 6.25SGFSCPCCLPRR60 pKa = 6.09
Molecular weight: 6.57 kDa
Isoelectric point according different methods:
Protein with the highest isoelectric point:
>tr|A0A0P0NMX4|A0A0P0NMX4_9SPHI TonB-dependent receptor OS=Pedobacter sp. PACM 27299 OX=1727164 GN=AQ505_16620 PE=3 SV=1
MM1 pKa = 7.78GLRR4 pKa = 11.84KK5 pKa = 9.8FKK7 pKa = 10.46PVTPGTRR14 pKa = 11.84FRR16 pKa = 11.84VGASFSEE23 pKa = 4.18ITATKK28 pKa = 9.4PEE30 pKa = 3.92KK31 pKa = 10.78SLVVSSKK38 pKa = 10.94KK39 pKa = 10.5SGGRR43 pKa = 11.84NNTGKK48 pKa = 8.1MTMRR52 pKa = 11.84YY53 pKa = 8.57MGGGHH58 pKa = 6.3KK59 pKa = 10.01KK60 pKa = 9.96SYY62 pKa = 10.67RR63 pKa = 11.84LIDD66 pKa = 3.84FKK68 pKa = 10.93RR69 pKa = 11.84DD70 pKa = 3.21KK71 pKa = 11.05FNIPATVATVEE82 pKa = 3.94YY83 pKa = 10.46DD84 pKa = 3.37PNRR87 pKa = 11.84TARR90 pKa = 11.84IALLHH95 pKa = 5.81YY96 pKa = 10.78ADD98 pKa = 3.89GEE100 pKa = 4.06KK101 pKa = 10.2RR102 pKa = 11.84YY103 pKa = 10.16IIAPEE108 pKa = 4.2GLQVGQTVVSGDD120 pKa = 3.44TASPEE125 pKa = 3.94VGNALTLSRR134 pKa = 11.84IPLGSIVHH142 pKa = 6.53NIEE145 pKa = 3.71IQPGRR150 pKa = 11.84GAQMARR156 pKa = 11.84SAGAYY161 pKa = 8.57AQLAARR167 pKa = 11.84DD168 pKa = 3.89GKK170 pKa = 10.52YY171 pKa = 9.12ATVKK175 pKa = 9.72MPSGEE180 pKa = 3.85VRR182 pKa = 11.84AILVTCLATIGAVSNSDD199 pKa = 3.27HH200 pKa = 6.69ANEE203 pKa = 4.23VLGKK207 pKa = 10.21AGRR210 pKa = 11.84KK211 pKa = 7.93RR212 pKa = 11.84WLGRR216 pKa = 11.84RR217 pKa = 11.84PRR219 pKa = 11.84TRR221 pKa = 11.84PVAMNPVDD229 pKa = 3.63HH230 pKa = 7.13PMGGGEE236 pKa = 4.2GRR238 pKa = 11.84SSGGQPRR245 pKa = 11.84SRR247 pKa = 11.84NGLYY251 pKa = 10.68SKK253 pKa = 10.76GFKK256 pKa = 9.23TRR258 pKa = 11.84SLKK261 pKa = 10.55KK262 pKa = 8.95YY263 pKa = 7.96SNRR266 pKa = 11.84FIIEE270 pKa = 3.89KK271 pKa = 10.02RR272 pKa = 11.84KK273 pKa = 9.88KK274 pKa = 9.89
MM1 pKa = 7.78GLRR4 pKa = 11.84KK5 pKa = 9.8FKK7 pKa = 10.46PVTPGTRR14 pKa = 11.84FRR16 pKa = 11.84VGASFSEE23 pKa = 4.18ITATKK28 pKa = 9.4PEE30 pKa = 3.92KK31 pKa = 10.78SLVVSSKK38 pKa = 10.94KK39 pKa = 10.5SGGRR43 pKa = 11.84NNTGKK48 pKa = 8.1MTMRR52 pKa = 11.84YY53 pKa = 8.57MGGGHH58 pKa = 6.3KK59 pKa = 10.01KK60 pKa = 9.96SYY62 pKa = 10.67RR63 pKa = 11.84LIDD66 pKa = 3.84FKK68 pKa = 10.93RR69 pKa = 11.84DD70 pKa = 3.21KK71 pKa = 11.05FNIPATVATVEE82 pKa = 3.94YY83 pKa = 10.46DD84 pKa = 3.37PNRR87 pKa = 11.84TARR90 pKa = 11.84IALLHH95 pKa = 5.81YY96 pKa = 10.78ADD98 pKa = 3.89GEE100 pKa = 4.06KK101 pKa = 10.2RR102 pKa = 11.84YY103 pKa = 10.16IIAPEE108 pKa = 4.2GLQVGQTVVSGDD120 pKa = 3.44TASPEE125 pKa = 3.94VGNALTLSRR134 pKa = 11.84IPLGSIVHH142 pKa = 6.53NIEE145 pKa = 3.71IQPGRR150 pKa = 11.84GAQMARR156 pKa = 11.84SAGAYY161 pKa = 8.57AQLAARR167 pKa = 11.84DD168 pKa = 3.89GKK170 pKa = 10.52YY171 pKa = 9.12ATVKK175 pKa = 9.72MPSGEE180 pKa = 3.85VRR182 pKa = 11.84AILVTCLATIGAVSNSDD199 pKa = 3.27HH200 pKa = 6.69ANEE203 pKa = 4.23VLGKK207 pKa = 10.21AGRR210 pKa = 11.84KK211 pKa = 7.93RR212 pKa = 11.84WLGRR216 pKa = 11.84RR217 pKa = 11.84PRR219 pKa = 11.84TRR221 pKa = 11.84PVAMNPVDD229 pKa = 3.63HH230 pKa = 7.13PMGGGEE236 pKa = 4.2GRR238 pKa = 11.84SSGGQPRR245 pKa = 11.84SRR247 pKa = 11.84NGLYY251 pKa = 10.68SKK253 pKa = 10.76GFKK256 pKa = 9.23TRR258 pKa = 11.84SLKK261 pKa = 10.55KK262 pKa = 8.95YY263 pKa = 7.96SNRR266 pKa = 11.84FIIEE270 pKa = 3.89KK271 pKa = 10.02RR272 pKa = 11.84KK273 pKa = 9.88KK274 pKa = 9.89
Molecular weight: 29.79 kDa
Isoelectric point according different methods:
Peptides (in silico digests for buttom-up proteomics)
Below you can find in silico digests of the whole proteome with Trypsin, Chymotrypsin, Trypsin+LysC, LysN, ArgC proteases suitable for different mass spec machines.| Try ESI |
 |
|---|
| ChTry ESI |
|
|---|
| ArgC ESI |
|
|---|
| LysN ESI |
|
|---|
| TryLysC ESI |
|
|---|
| Try MALDI |
|
|---|
| ChTry MALDI |
|
|---|
| ArgC MALDI |
|
|---|
| LysN MALDI |
|
|---|
| TryLysC MALDI |
|
|---|
| Try LTQ |
|
|---|
| ChTry LTQ |
|
|---|
| ArgC LTQ |
|
|---|
| LysN LTQ |
|
|---|
| TryLysC LTQ |
|
|---|
| Try MSlow |
|
|---|
| ChTry MSlow |
|
|---|
| ArgC MSlow |
|
|---|
| LysN MSlow |
|
|---|
| TryLysC MSlow |
|
|---|
| Try MShigh |
|
|---|
| ChTry MShigh |
|
|---|
| ArgC MShigh |
|
|---|
| LysN MShigh |
|
|---|
| TryLysC MShigh |
|
|---|
General Statistics
Number of major isoforms |
Number of additional isoforms |
Number of all proteins |
Number of amino acids |
Min. Seq. Length |
Max. Seq. Length |
Avg. Seq. Length |
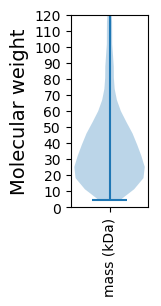
Avg. Mol. Weight |
|---|---|---|---|---|---|---|---|
0 |
1786279 |
36 |
6578 |
359.7 |
40.28 |
Amino acid frequency
Ala |
Cys |
Asp |
Glu |
Phe |
Gly |
His |
Ile |
Lys |
Leu |
|---|---|---|---|---|---|---|---|---|---|
7.541 ± 0.037 | 0.718 ± 0.011 |
5.177 ± 0.022 | 5.792 ± 0.036 |
4.931 ± 0.026 | 6.86 ± 0.038 |
1.779 ± 0.019 | 7.184 ± 0.031 |
7.243 ± 0.04 | 9.835 ± 0.04 |
Met |
Asn |
Gln |
Pro |
Arg |
Ser |
Thr |
Val |
Trp |
Tyr |
|---|---|---|---|---|---|---|---|---|---|
2.367 ± 0.018 | 5.635 ± 0.035 |
3.814 ± 0.017 | 3.778 ± 0.021 |
3.709 ± 0.023 | 6.559 ± 0.03 |
5.668 ± 0.056 | 6.173 ± 0.03 |
1.145 ± 0.013 | 4.094 ± 0.025 |
Most of the basic statistics you can see at this page can be downloaded from this CSV file
See this proteome in:

Proteome-pI is available under Creative Commons Attribution-NoDerivs license, for more details see here
| Reference: Kozlowski LP. Proteome-pI 2.0: Proteome Isoelectric Point Database Update. Nucleic Acids Res. 2021, doi: 10.1093/nar/gkab944 | Contact: Lukasz P. Kozlowski |