Arthrobacter phage Edmundo
Taxonomy: Viruses; Duplodnaviria; Heunggongvirae; Uroviricota; Caudoviricetes; Caudovirales; Siphoviridae; Laroyevirus; unclassified Laroyevirus
Average proteome isoelectric point is 6.44
Get precalculated fractions of proteins
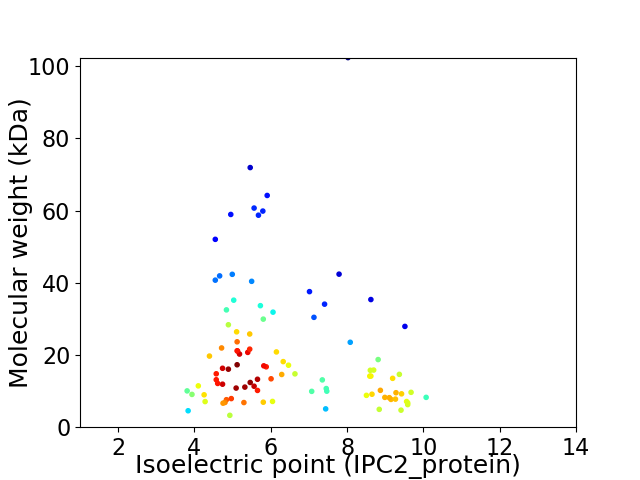
Virtual 2D-PAGE plot for 98 proteins (isoelectric point calculated using IPC2_protein)
Get csv file with sequences according to given criteria:
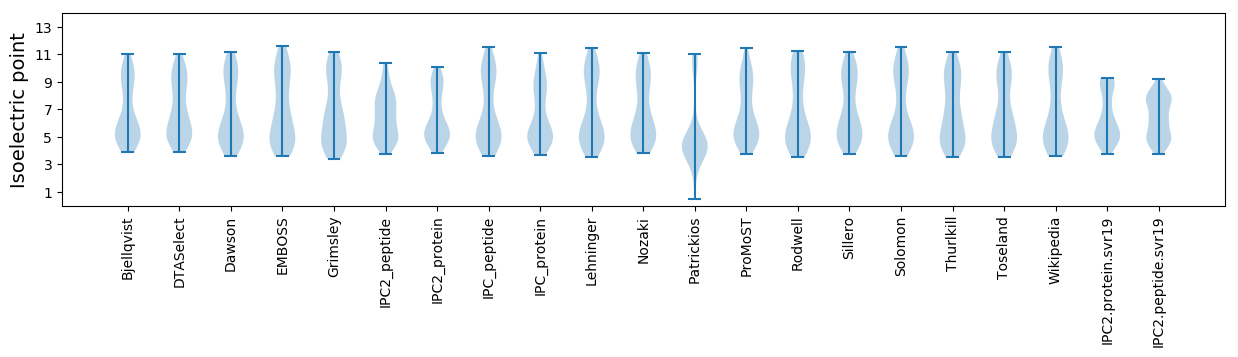
* You can choose from 21 different methods for calculating isoelectric point
Summary statistics related to proteome-wise predictions
Protein with the lowest isoelectric point:
>tr|A0A649V8J0|A0A649V8J0_9CAUD Uncharacterized protein OS=Arthrobacter phage Edmundo OX=2656524 GN=40 PE=4 SV=1
MM1 pKa = 7.52AAKK4 pKa = 8.47THH6 pKa = 6.33QGDD9 pKa = 4.51CVDD12 pKa = 4.42IDD14 pKa = 3.78PFIPTGQCALCTDD27 pKa = 4.67TPQDD31 pKa = 3.83TIPPEE36 pKa = 4.28DD37 pKa = 3.89RR38 pKa = 11.84DD39 pKa = 3.88GGVQQ43 pKa = 3.24
MM1 pKa = 7.52AAKK4 pKa = 8.47THH6 pKa = 6.33QGDD9 pKa = 4.51CVDD12 pKa = 4.42IDD14 pKa = 3.78PFIPTGQCALCTDD27 pKa = 4.67TPQDD31 pKa = 3.83TIPPEE36 pKa = 4.28DD37 pKa = 3.89RR38 pKa = 11.84DD39 pKa = 3.88GGVQQ43 pKa = 3.24
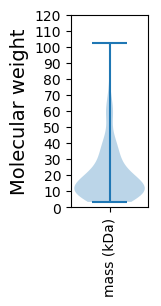
Molecular weight: 4.56 kDa
Isoelectric point according different methods:
Protein with the highest isoelectric point:
>tr|A0A649V6Y1|A0A649V6Y1_9CAUD Uncharacterized protein OS=Arthrobacter phage Edmundo OX=2656524 GN=2 PE=4 SV=1
MM1 pKa = 7.36TAPKK5 pKa = 9.6PRR7 pKa = 11.84PLKK10 pKa = 9.73PLPKK14 pKa = 9.09PSPPAGSRR22 pKa = 11.84AFDD25 pKa = 4.86DD26 pKa = 3.6MLQTYY31 pKa = 9.61YY32 pKa = 11.01EE33 pKa = 4.2MPGCRR38 pKa = 11.84EE39 pKa = 3.99LVNGIIEE46 pKa = 4.19RR47 pKa = 11.84KK48 pKa = 8.83RR49 pKa = 11.84ARR51 pKa = 11.84EE52 pKa = 3.67GAKK55 pKa = 10.02VVEE58 pKa = 4.51SRR60 pKa = 11.84ARR62 pKa = 11.84RR63 pKa = 3.46
MM1 pKa = 7.36TAPKK5 pKa = 9.6PRR7 pKa = 11.84PLKK10 pKa = 9.73PLPKK14 pKa = 9.09PSPPAGSRR22 pKa = 11.84AFDD25 pKa = 4.86DD26 pKa = 3.6MLQTYY31 pKa = 9.61YY32 pKa = 11.01EE33 pKa = 4.2MPGCRR38 pKa = 11.84EE39 pKa = 3.99LVNGIIEE46 pKa = 4.19RR47 pKa = 11.84KK48 pKa = 8.83RR49 pKa = 11.84ARR51 pKa = 11.84EE52 pKa = 3.67GAKK55 pKa = 10.02VVEE58 pKa = 4.51SRR60 pKa = 11.84ARR62 pKa = 11.84RR63 pKa = 3.46
Molecular weight: 7.12 kDa
Isoelectric point according different methods:
Peptides (in silico digests for buttom-up proteomics)
Below you can find in silico digests of the whole proteome with Trypsin, Chymotrypsin, Trypsin+LysC, LysN, ArgC proteases suitable for different mass spec machines.| Try ESI |
 |
|---|
| ChTry ESI |
|
|---|
| ArgC ESI |
|
|---|
| LysN ESI |
|
|---|
| TryLysC ESI |
|
|---|
| Try MALDI |
|
|---|
| ChTry MALDI |
|
|---|
| ArgC MALDI |
|
|---|
| LysN MALDI |
|
|---|
| TryLysC MALDI |
|
|---|
| Try LTQ |
|
|---|
| ChTry LTQ |
|
|---|
| ArgC LTQ |
|
|---|
| LysN LTQ |
|
|---|
| TryLysC LTQ |
|
|---|
| Try MSlow |
|
|---|
| ChTry MSlow |
|
|---|
| ArgC MSlow |
|
|---|
| LysN MSlow |
|
|---|
| TryLysC MSlow |
|
|---|
| Try MShigh |
|
|---|
| ChTry MShigh |
|
|---|
| ArgC MShigh |
|
|---|
| LysN MShigh |
|
|---|
| TryLysC MShigh |
|
|---|
General Statistics
Number of major isoforms |
Number of additional isoforms |
Number of all proteins |
Number of amino acids |
Min. Seq. Length |
Max. Seq. Length |
Avg. Seq. Length |
Avg. Mol. Weight |
|---|---|---|---|---|---|---|---|
0 |
18692 |
27 |
1005 |
190.7 |
20.72 |
Amino acid frequency
Ala |
Cys |
Asp |
Glu |
Phe |
Gly |
His |
Ile |
Lys |
Leu |
|---|---|---|---|---|---|---|---|---|---|
11.802 ± 0.48 | 0.776 ± 0.125 |
5.623 ± 0.281 | 6.072 ± 0.326 |
2.557 ± 0.199 | 8.485 ± 0.332 |
2.108 ± 0.144 | 4.761 ± 0.283 |
4.157 ± 0.284 | 7.431 ± 0.232 |
Met |
Asn |
Gln |
Pro |
Arg |
Ser |
Thr |
Val |
Trp |
Tyr |
|---|---|---|---|---|---|---|---|---|---|
2.45 ± 0.111 | 3.274 ± 0.161 |
5.719 ± 0.257 | 3.649 ± 0.24 |
6.152 ± 0.349 | 5.468 ± 0.281 |
7.42 ± 0.339 | 7.527 ± 0.215 |
1.862 ± 0.09 | 2.707 ± 0.181 |
Most of the basic statistics you can see at this page can be downloaded from this CSV file
See this proteome in:

Proteome-pI is available under Creative Commons Attribution-NoDerivs license, for more details see here
| Reference: Kozlowski LP. Proteome-pI 2.0: Proteome Isoelectric Point Database Update. Nucleic Acids Res. 2021, doi: 10.1093/nar/gkab944 | Contact: Lukasz P. Kozlowski |