Iodobacter phage PhiPLPE
Taxonomy: Viruses; Duplodnaviria; Heunggongvirae; Uroviricota; Caudoviricetes; Caudovirales; Myoviridae; Iodovirus; Iodobacter virus PLPE
Average proteome isoelectric point is 6.22
Get precalculated fractions of proteins
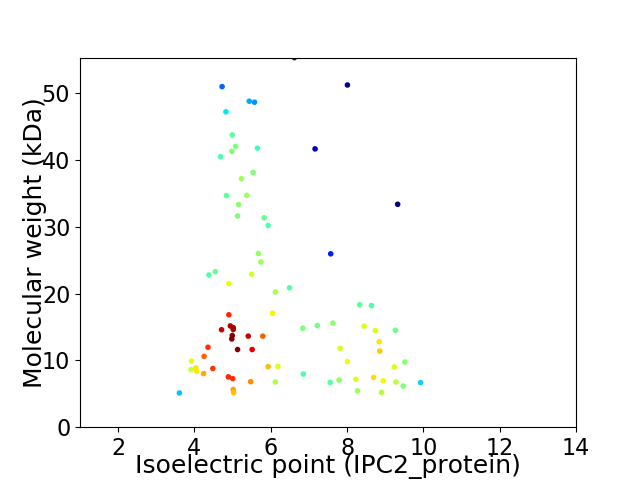
Virtual 2D-PAGE plot for 84 proteins (isoelectric point calculated using IPC2_protein)
Get csv file with sequences according to given criteria:
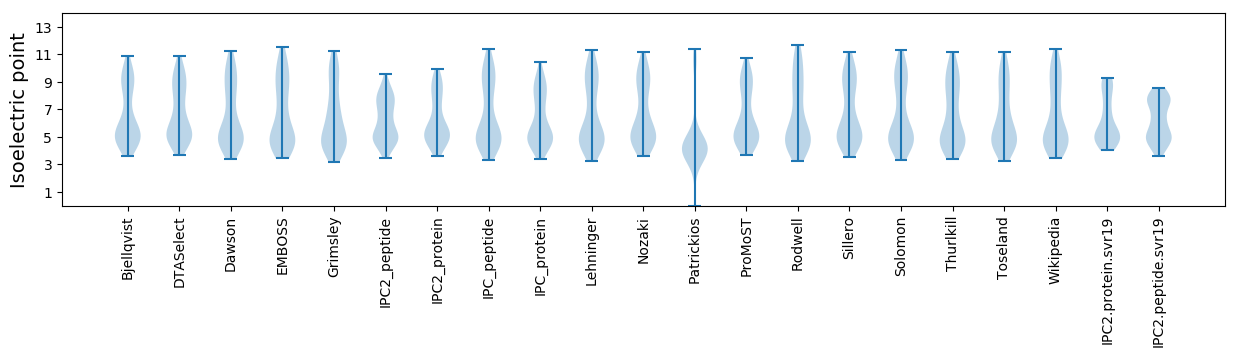
* You can choose from 21 different methods for calculating isoelectric point
Summary statistics related to proteome-wise predictions
Protein with the lowest isoelectric point:
>tr|B5AX69|B5AX69_9CAUD Uncharacterized protein OS=Iodobacter phage PhiPLPE OX=551895 GN=phiPLPE_50 PE=4 SV=1
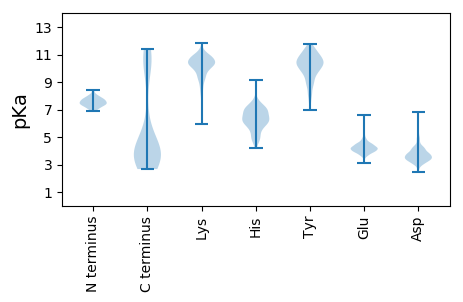
MM1 pKa = 7.57RR2 pKa = 11.84PCVGVGGACPPLCTWAQLEE21 pKa = 4.41DD22 pKa = 3.76GTYY25 pKa = 10.76SLADD29 pKa = 3.04VEE31 pKa = 4.85MFNQALDD38 pKa = 3.9DD39 pKa = 4.4VIEE42 pKa = 4.88ANTPPQQ48 pKa = 3.35
MM1 pKa = 7.57RR2 pKa = 11.84PCVGVGGACPPLCTWAQLEE21 pKa = 4.41DD22 pKa = 3.76GTYY25 pKa = 10.76SLADD29 pKa = 3.04VEE31 pKa = 4.85MFNQALDD38 pKa = 3.9DD39 pKa = 4.4VIEE42 pKa = 4.88ANTPPQQ48 pKa = 3.35
Molecular weight: 5.12 kDa
Isoelectric point according different methods:
Protein with the highest isoelectric point:
>tr|B5AX27|B5AX27_9CAUD Uncharacterized protein OS=Iodobacter phage PhiPLPE OX=551895 GN=phiPLPE_08 PE=4 SV=1
MM1 pKa = 7.72SEE3 pKa = 3.92AKK5 pKa = 10.78YY6 pKa = 10.34FGAWDD11 pKa = 3.3QGKK14 pKa = 8.75SLRR17 pKa = 11.84GGTIAQTKK25 pKa = 8.5QVSPTALRR33 pKa = 11.84YY34 pKa = 7.41TCARR38 pKa = 11.84CNVFLGRR45 pKa = 11.84HH46 pKa = 4.99NEE48 pKa = 3.99APVCHH53 pKa = 6.58CGSTRR58 pKa = 11.84FHH60 pKa = 7.23SGRR63 pKa = 3.61
MM1 pKa = 7.72SEE3 pKa = 3.92AKK5 pKa = 10.78YY6 pKa = 10.34FGAWDD11 pKa = 3.3QGKK14 pKa = 8.75SLRR17 pKa = 11.84GGTIAQTKK25 pKa = 8.5QVSPTALRR33 pKa = 11.84YY34 pKa = 7.41TCARR38 pKa = 11.84CNVFLGRR45 pKa = 11.84HH46 pKa = 4.99NEE48 pKa = 3.99APVCHH53 pKa = 6.58CGSTRR58 pKa = 11.84FHH60 pKa = 7.23SGRR63 pKa = 3.61
Molecular weight: 6.95 kDa
Isoelectric point according different methods:
Peptides (in silico digests for buttom-up proteomics)
Below you can find in silico digests of the whole proteome with Trypsin, Chymotrypsin, Trypsin+LysC, LysN, ArgC proteases suitable for different mass spec machines.| Try ESI |
 |
|---|
| ChTry ESI |
|
|---|
| ArgC ESI |
|
|---|
| LysN ESI |
|
|---|
| TryLysC ESI |
|
|---|
| Try MALDI |
|
|---|
| ChTry MALDI |
|
|---|
| ArgC MALDI |
|
|---|
| LysN MALDI |
|
|---|
| TryLysC MALDI |
|
|---|
| Try LTQ |
|
|---|
| ChTry LTQ |
|
|---|
| ArgC LTQ |
|
|---|
| LysN LTQ |
|
|---|
| TryLysC LTQ |
|
|---|
| Try MSlow |
|
|---|
| ChTry MSlow |
|
|---|
| ArgC MSlow |
|
|---|
| LysN MSlow |
|
|---|
| TryLysC MSlow |
|
|---|
| Try MShigh |
|
|---|
| ChTry MShigh |
|
|---|
| ArgC MShigh |
|
|---|
| LysN MShigh |
|
|---|
| TryLysC MShigh |
|
|---|
General Statistics
Number of major isoforms |
Number of additional isoforms |
Number of all proteins |
Number of amino acids |
Min. Seq. Length |
Max. Seq. Length |
Avg. Seq. Length |
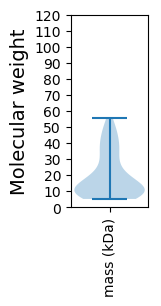
Avg. Mol. Weight |
|---|---|---|---|---|---|---|---|
0 |
14877 |
45 |
483 |
177.1 |
19.5 |
Amino acid frequency
Ala |
Cys |
Asp |
Glu |
Phe |
Gly |
His |
Ile |
Lys |
Leu |
|---|---|---|---|---|---|---|---|---|---|
10.036 ± 0.399 | 1.324 ± 0.121 |
6.231 ± 0.234 | 5.989 ± 0.328 |
3.482 ± 0.182 | 7.434 ± 0.324 |
1.264 ± 0.106 | 6.413 ± 0.2 |
6.392 ± 0.295 | 7.488 ± 0.271 |
Met |
Asn |
Gln |
Pro |
Arg |
Ser |
Thr |
Val |
Trp |
Tyr |
|---|---|---|---|---|---|---|---|---|---|
2.796 ± 0.119 | 4.961 ± 0.222 |
3.811 ± 0.18 | 3.569 ± 0.2 |
4.591 ± 0.209 | 6.735 ± 0.295 |
5.902 ± 0.343 | 6.695 ± 0.217 |
1.492 ± 0.133 | 3.395 ± 0.173 |
Most of the basic statistics you can see at this page can be downloaded from this CSV file
See this proteome in:

Proteome-pI is available under Creative Commons Attribution-NoDerivs license, for more details see here
| Reference: Kozlowski LP. Proteome-pI 2.0: Proteome Isoelectric Point Database Update. Nucleic Acids Res. 2021, doi: 10.1093/nar/gkab944 | Contact: Lukasz P. Kozlowski |