Desulfobulbus oralis
Taxonomy: cellular organisms; Bacteria; Proteobacteria; delta/epsilon subdivisions; Deltaproteobacteria; Desulfobacterales; Desulfobulbaceae; Desulfobulbus
Average proteome isoelectric point is 6.96
Get precalculated fractions of proteins
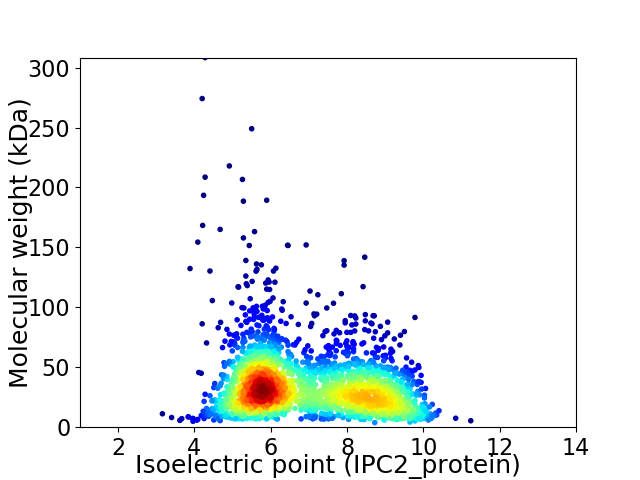
Virtual 2D-PAGE plot for 2278 proteins (isoelectric point calculated using IPC2_protein)
Get csv file with sequences according to given criteria:
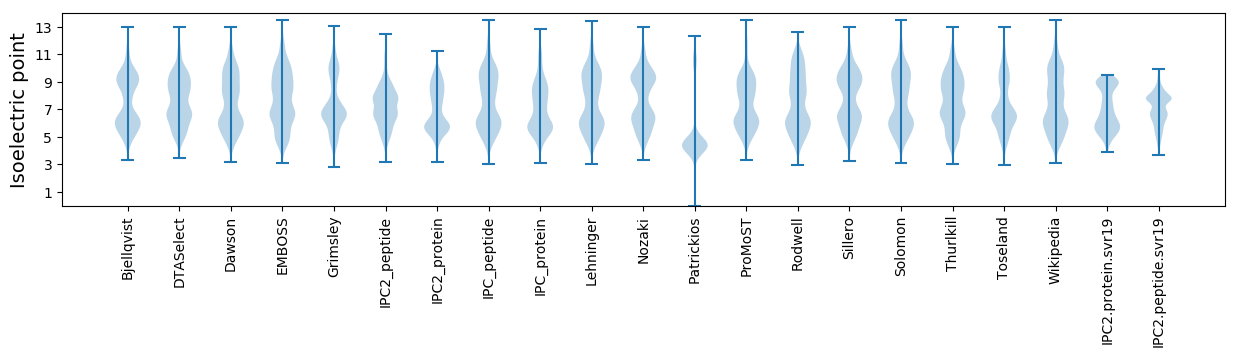
* You can choose from 21 different methods for calculating isoelectric point
Summary statistics related to proteome-wise predictions
Protein with the lowest isoelectric point:
>tr|A0A2L1GMG9|A0A2L1GMG9_9DELT Type I-E CRISPR-associated protein Cas6/Cse3/CasE OS=Desulfobulbus oralis OX=1986146 GN=CAY53_04850 PE=4 SV=1
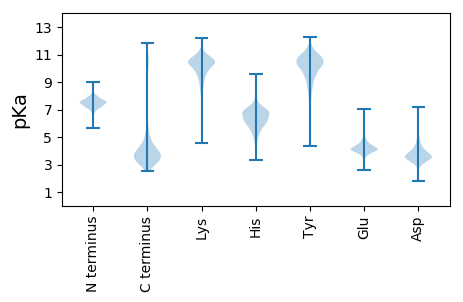
MM1 pKa = 7.7KK2 pKa = 10.21KK3 pKa = 9.85YY4 pKa = 10.35QCDD7 pKa = 3.52VCGYY11 pKa = 10.01VYY13 pKa = 10.68DD14 pKa = 4.46PAVGDD19 pKa = 3.99PDD21 pKa = 4.71GGIAPGTAFEE31 pKa = 5.99DD32 pKa = 4.17IPADD36 pKa = 3.67WVCPVCGAAKK46 pKa = 10.39DD47 pKa = 3.97DD48 pKa = 4.25FSPVEE53 pKa = 4.07DD54 pKa = 3.62
MM1 pKa = 7.7KK2 pKa = 10.21KK3 pKa = 9.85YY4 pKa = 10.35QCDD7 pKa = 3.52VCGYY11 pKa = 10.01VYY13 pKa = 10.68DD14 pKa = 4.46PAVGDD19 pKa = 3.99PDD21 pKa = 4.71GGIAPGTAFEE31 pKa = 5.99DD32 pKa = 4.17IPADD36 pKa = 3.67WVCPVCGAAKK46 pKa = 10.39DD47 pKa = 3.97DD48 pKa = 4.25FSPVEE53 pKa = 4.07DD54 pKa = 3.62
Molecular weight: 5.7 kDa
Isoelectric point according different methods:
Protein with the highest isoelectric point:
>tr|A0A2L1GRL1|A0A2L1GRL1_9DELT Aspartate racemase OS=Desulfobulbus oralis OX=1986146 GN=CAY53_07770 PE=3 SV=1
MM1 pKa = 7.56SKK3 pKa = 10.81GKK5 pKa = 8.71GTFQPGRR12 pKa = 11.84TSRR15 pKa = 11.84SRR17 pKa = 11.84THH19 pKa = 6.2GFLVRR24 pKa = 11.84MRR26 pKa = 11.84TRR28 pKa = 11.84SGQSVIRR35 pKa = 11.84RR36 pKa = 11.84RR37 pKa = 11.84RR38 pKa = 11.84AKK40 pKa = 10.04GRR42 pKa = 11.84KK43 pKa = 8.32QLAPP47 pKa = 3.78
MM1 pKa = 7.56SKK3 pKa = 10.81GKK5 pKa = 8.71GTFQPGRR12 pKa = 11.84TSRR15 pKa = 11.84SRR17 pKa = 11.84THH19 pKa = 6.2GFLVRR24 pKa = 11.84MRR26 pKa = 11.84TRR28 pKa = 11.84SGQSVIRR35 pKa = 11.84RR36 pKa = 11.84RR37 pKa = 11.84RR38 pKa = 11.84AKK40 pKa = 10.04GRR42 pKa = 11.84KK43 pKa = 8.32QLAPP47 pKa = 3.78
Molecular weight: 5.38 kDa
Isoelectric point according different methods:
Peptides (in silico digests for buttom-up proteomics)
Below you can find in silico digests of the whole proteome with Trypsin, Chymotrypsin, Trypsin+LysC, LysN, ArgC proteases suitable for different mass spec machines.| Try ESI |
 |
|---|
| ChTry ESI |
|
|---|
| ArgC ESI |
|
|---|
| LysN ESI |
|
|---|
| TryLysC ESI |
|
|---|
| Try MALDI |
|
|---|
| ChTry MALDI |
|
|---|
| ArgC MALDI |
|
|---|
| LysN MALDI |
|
|---|
| TryLysC MALDI |
|
|---|
| Try LTQ |
|
|---|
| ChTry LTQ |
|
|---|
| ArgC LTQ |
|
|---|
| LysN LTQ |
|
|---|
| TryLysC LTQ |
|
|---|
| Try MSlow |
|
|---|
| ChTry MSlow |
|
|---|
| ArgC MSlow |
|
|---|
| LysN MSlow |
|
|---|
| TryLysC MSlow |
|
|---|
| Try MShigh |
|
|---|
| ChTry MShigh |
|
|---|
| ArgC MShigh |
|
|---|
| LysN MShigh |
|
|---|
| TryLysC MShigh |
|
|---|
General Statistics
Number of major isoforms |
Number of additional isoforms |
Number of all proteins |
Number of amino acids |
Min. Seq. Length |
Max. Seq. Length |
Avg. Seq. Length |
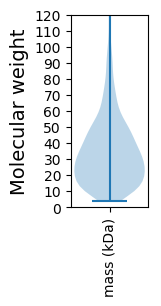
Avg. Mol. Weight |
|---|---|---|---|---|---|---|---|
0 |
767338 |
35 |
2969 |
336.8 |
37.0 |
Amino acid frequency
Ala |
Cys |
Asp |
Glu |
Phe |
Gly |
His |
Ile |
Lys |
Leu |
|---|---|---|---|---|---|---|---|---|---|
11.33 ± 0.081 | 1.515 ± 0.022 |
4.963 ± 0.042 | 6.018 ± 0.045 |
3.92 ± 0.036 | 8.195 ± 0.061 |
2.21 ± 0.022 | 4.971 ± 0.051 |
3.784 ± 0.044 | 11.362 ± 0.076 |
Met |
Asn |
Gln |
Pro |
Arg |
Ser |
Thr |
Val |
Trp |
Tyr |
|---|---|---|---|---|---|---|---|---|---|
2.544 ± 0.022 | 2.843 ± 0.033 |
4.944 ± 0.038 | 3.953 ± 0.033 |
7.131 ± 0.055 | 5.375 ± 0.047 |
4.558 ± 0.032 | 6.572 ± 0.041 |
1.209 ± 0.021 | 2.602 ± 0.029 |
Most of the basic statistics you can see at this page can be downloaded from this CSV file
See this proteome in:

Proteome-pI is available under Creative Commons Attribution-NoDerivs license, for more details see here
| Reference: Kozlowski LP. Proteome-pI 2.0: Proteome Isoelectric Point Database Update. Nucleic Acids Res. 2021, doi: 10.1093/nar/gkab944 | Contact: Lukasz P. Kozlowski |