Eubacterium nodatum ATCC 33099
Taxonomy: cellular organisms; Bacteria; Terrabacteria group; Firmicutes; Clostridia; Eubacteriales; Eubacteriales incertae sedis; Eubacteriales Family XIII. Incertae Sedis; [Eubacterium] nodatum
Average proteome isoelectric point is 6.77
Get precalculated fractions of proteins
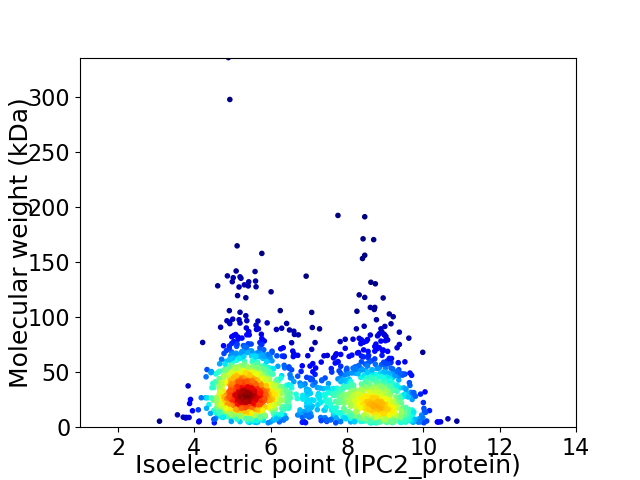
Virtual 2D-PAGE plot for 1690 proteins (isoelectric point calculated using IPC2_protein)
Get csv file with sequences according to given criteria:
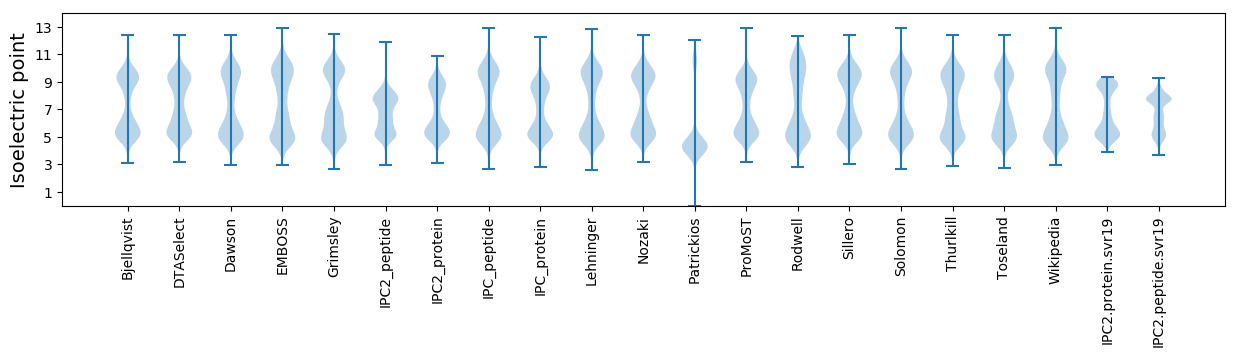
* You can choose from 21 different methods for calculating isoelectric point
Summary statistics related to proteome-wise predictions
Protein with the lowest isoelectric point:
>tr|W2BZ06|W2BZ06_9FIRM Preprotein translocase YajC subunit OS=Eubacterium nodatum ATCC 33099 OX=1161902 GN=yajC PE=3 SV=1
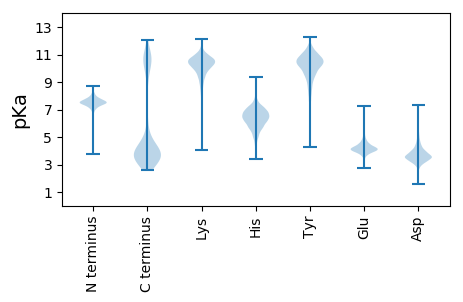
MM1 pKa = 7.48IGSSITVIGVLSGVIINGDD20 pKa = 3.46PAGVYY25 pKa = 9.58TIFGVSLTLLGVYY38 pKa = 10.39LSSKK42 pKa = 9.74EE43 pKa = 4.12IEE45 pKa = 4.28DD46 pKa = 3.84TAA48 pKa = 5.12
MM1 pKa = 7.48IGSSITVIGVLSGVIINGDD20 pKa = 3.46PAGVYY25 pKa = 9.58TIFGVSLTLLGVYY38 pKa = 10.39LSSKK42 pKa = 9.74EE43 pKa = 4.12IEE45 pKa = 4.28DD46 pKa = 3.84TAA48 pKa = 5.12
Molecular weight: 4.87 kDa
Isoelectric point according different methods:
Protein with the highest isoelectric point:
>tr|W2BZL1|W2BZL1_9FIRM ABC transporter ATP-binding protein OS=Eubacterium nodatum ATCC 33099 OX=1161902 GN=HMPREF0378_1271 PE=4 SV=1
MM1 pKa = 7.14KK2 pKa = 9.31QTYY5 pKa = 7.66QPKK8 pKa = 9.15KK9 pKa = 7.6RR10 pKa = 11.84QRR12 pKa = 11.84KK13 pKa = 8.39KK14 pKa = 8.49EE15 pKa = 3.5HH16 pKa = 6.04GFRR19 pKa = 11.84KK20 pKa = 10.07RR21 pKa = 11.84MATKK25 pKa = 10.07NGRR28 pKa = 11.84RR29 pKa = 11.84VLKK32 pKa = 10.3RR33 pKa = 11.84RR34 pKa = 11.84RR35 pKa = 11.84TRR37 pKa = 11.84GRR39 pKa = 11.84KK40 pKa = 9.27KK41 pKa = 9.65LTAA44 pKa = 4.27
MM1 pKa = 7.14KK2 pKa = 9.31QTYY5 pKa = 7.66QPKK8 pKa = 9.15KK9 pKa = 7.6RR10 pKa = 11.84QRR12 pKa = 11.84KK13 pKa = 8.39KK14 pKa = 8.49EE15 pKa = 3.5HH16 pKa = 6.04GFRR19 pKa = 11.84KK20 pKa = 10.07RR21 pKa = 11.84MATKK25 pKa = 10.07NGRR28 pKa = 11.84RR29 pKa = 11.84VLKK32 pKa = 10.3RR33 pKa = 11.84RR34 pKa = 11.84RR35 pKa = 11.84TRR37 pKa = 11.84GRR39 pKa = 11.84KK40 pKa = 9.27KK41 pKa = 9.65LTAA44 pKa = 4.27
Molecular weight: 5.5 kDa
Isoelectric point according different methods:
Peptides (in silico digests for buttom-up proteomics)
Below you can find in silico digests of the whole proteome with Trypsin, Chymotrypsin, Trypsin+LysC, LysN, ArgC proteases suitable for different mass spec machines.| Try ESI |
 |
|---|
| ChTry ESI |
|
|---|
| ArgC ESI |
|
|---|
| LysN ESI |
|
|---|
| TryLysC ESI |
|
|---|
| Try MALDI |
|
|---|
| ChTry MALDI |
|
|---|
| ArgC MALDI |
|
|---|
| LysN MALDI |
|
|---|
| TryLysC MALDI |
|
|---|
| Try LTQ |
|
|---|
| ChTry LTQ |
|
|---|
| ArgC LTQ |
|
|---|
| LysN LTQ |
|
|---|
| TryLysC LTQ |
|
|---|
| Try MSlow |
|
|---|
| ChTry MSlow |
|
|---|
| ArgC MSlow |
|
|---|
| LysN MSlow |
|
|---|
| TryLysC MSlow |
|
|---|
| Try MShigh |
|
|---|
| ChTry MShigh |
|
|---|
| ArgC MShigh |
|
|---|
| LysN MShigh |
|
|---|
| TryLysC MShigh |
|
|---|
General Statistics
Number of major isoforms |
Number of additional isoforms |
Number of all proteins |
Number of amino acids |
Min. Seq. Length |
Max. Seq. Length |
Avg. Seq. Length |
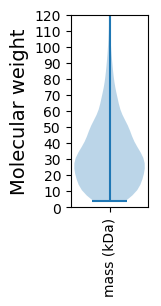
Avg. Mol. Weight |
|---|---|---|---|---|---|---|---|
0 |
541419 |
35 |
2906 |
320.4 |
36.02 |
Amino acid frequency
Ala |
Cys |
Asp |
Glu |
Phe |
Gly |
His |
Ile |
Lys |
Leu |
|---|---|---|---|---|---|---|---|---|---|
6.614 ± 0.06 | 1.251 ± 0.022 |
5.689 ± 0.041 | 7.565 ± 0.066 |
4.259 ± 0.048 | 7.183 ± 0.056 |
1.575 ± 0.022 | 8.343 ± 0.059 |
8.986 ± 0.084 | 8.459 ± 0.06 |
Met |
Asn |
Gln |
Pro |
Arg |
Ser |
Thr |
Val |
Trp |
Tyr |
|---|---|---|---|---|---|---|---|---|---|
2.98 ± 0.03 | 4.974 ± 0.05 |
3.051 ± 0.033 | 2.434 ± 0.024 |
4.268 ± 0.048 | 6.096 ± 0.041 |
5.056 ± 0.046 | 6.58 ± 0.042 |
0.753 ± 0.018 | 3.883 ± 0.045 |
Most of the basic statistics you can see at this page can be downloaded from this CSV file
See this proteome in:

Proteome-pI is available under Creative Commons Attribution-NoDerivs license, for more details see here
| Reference: Kozlowski LP. Proteome-pI 2.0: Proteome Isoelectric Point Database Update. Nucleic Acids Res. 2021, doi: 10.1093/nar/gkab944 | Contact: Lukasz P. Kozlowski |