Human adenovirus F serotype 41 (HAdV-41) (Human adenovirus 41)
Taxonomy: Viruses; Varidnaviria; Bamfordvirae; Preplasmiviricota; Tectiliviricetes; Rowavirales; Adenoviridae; Mastadenovirus; Human mastadenovirus F
Average proteome isoelectric point is 6.73
Get precalculated fractions of proteins
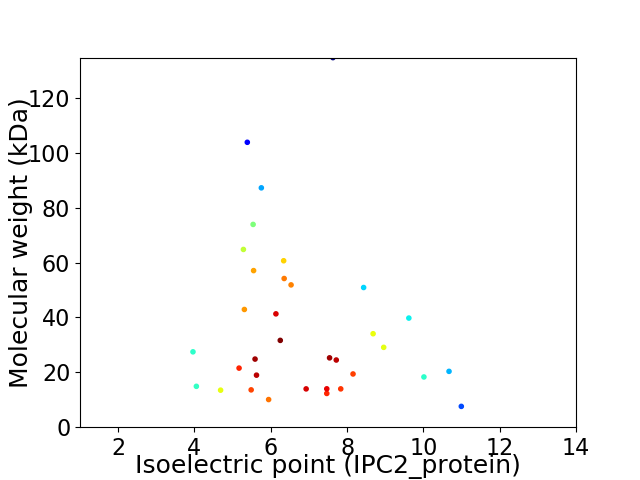
Virtual 2D-PAGE plot for 34 proteins (isoelectric point calculated using IPC2_protein)
Get csv file with sequences according to given criteria:
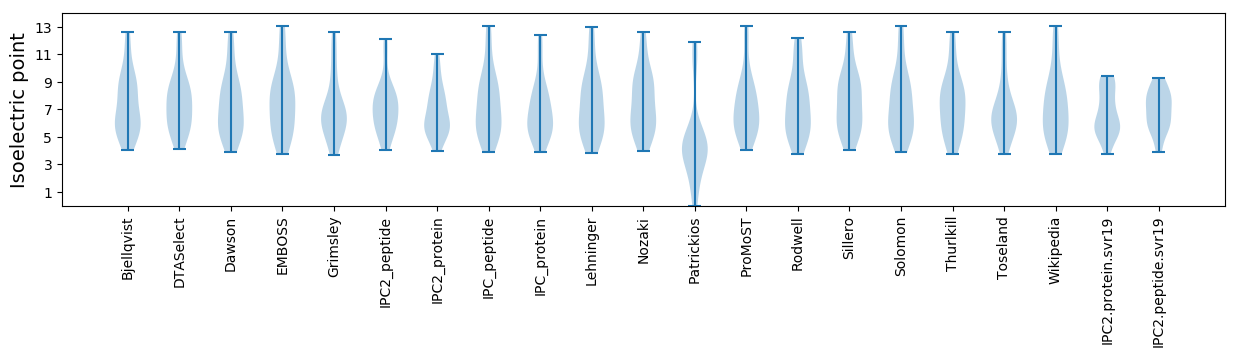
* You can choose from 21 different methods for calculating isoelectric point
Summary statistics related to proteome-wise predictions
Protein with the lowest isoelectric point:
>tr|A0A3G8WC22|A0A3G8WC22_ADE41 Protein 33K OS=Human adenovirus F serotype 41 OX=10524 PE=3 SV=1
MM1 pKa = 7.82RR2 pKa = 11.84MLPDD6 pKa = 4.24FFTGNWDD13 pKa = 4.4DD14 pKa = 3.84MFQGLLEE21 pKa = 4.54AEE23 pKa = 4.64HH24 pKa = 6.95PFDD27 pKa = 5.43FPEE30 pKa = 4.65PSQAFEE36 pKa = 4.59EE37 pKa = 4.55ISLHH41 pKa = 5.82NLFDD45 pKa = 3.88VEE47 pKa = 4.58LDD49 pKa = 3.61QSEE52 pKa = 4.28GDD54 pKa = 3.87PNEE57 pKa = 4.0EE58 pKa = 4.22AVDD61 pKa = 3.8GMFPNWMLSEE71 pKa = 4.17DD72 pKa = 3.6HH73 pKa = 6.83SADD76 pKa = 3.2SGAASGDD83 pKa = 3.7SGVGEE88 pKa = 4.64DD89 pKa = 4.06LVEE92 pKa = 4.2VNLDD96 pKa = 3.89LKK98 pKa = 10.84CYY100 pKa = 10.54EE101 pKa = 4.51EE102 pKa = 4.61GLPPSGSEE110 pKa = 3.46ADD112 pKa = 3.68EE113 pKa = 4.48AEE115 pKa = 4.04EE116 pKa = 3.75RR117 pKa = 11.84AEE119 pKa = 4.08EE120 pKa = 4.31EE121 pKa = 3.89EE122 pKa = 4.53TAVSNYY128 pKa = 9.45VNIAEE133 pKa = 4.64GASQLVLDD141 pKa = 4.83CPEE144 pKa = 4.02NPGRR148 pKa = 11.84GCRR151 pKa = 11.84ACDD154 pKa = 3.49FHH156 pKa = 8.58RR157 pKa = 11.84GSSGNPEE164 pKa = 4.02AMCALCYY171 pKa = 9.74MRR173 pKa = 11.84LTGHH177 pKa = 7.36CIYY180 pKa = 11.01SPISDD185 pKa = 4.11AEE187 pKa = 4.65GEE189 pKa = 4.54CEE191 pKa = 4.16LGSNEE196 pKa = 4.15EE197 pKa = 4.33TEE199 pKa = 4.82LPCSLTATAPVRR211 pKa = 11.84PTPCRR216 pKa = 11.84VSCRR220 pKa = 11.84RR221 pKa = 11.84RR222 pKa = 11.84PAVDD226 pKa = 4.25CIEE229 pKa = 4.89DD230 pKa = 4.01LLEE233 pKa = 4.6EE234 pKa = 5.07DD235 pKa = 4.52PTDD238 pKa = 3.6EE239 pKa = 4.98PLNLSLKK246 pKa = 10.08RR247 pKa = 11.84PKK249 pKa = 10.63SSS251 pKa = 2.91
MM1 pKa = 7.82RR2 pKa = 11.84MLPDD6 pKa = 4.24FFTGNWDD13 pKa = 4.4DD14 pKa = 3.84MFQGLLEE21 pKa = 4.54AEE23 pKa = 4.64HH24 pKa = 6.95PFDD27 pKa = 5.43FPEE30 pKa = 4.65PSQAFEE36 pKa = 4.59EE37 pKa = 4.55ISLHH41 pKa = 5.82NLFDD45 pKa = 3.88VEE47 pKa = 4.58LDD49 pKa = 3.61QSEE52 pKa = 4.28GDD54 pKa = 3.87PNEE57 pKa = 4.0EE58 pKa = 4.22AVDD61 pKa = 3.8GMFPNWMLSEE71 pKa = 4.17DD72 pKa = 3.6HH73 pKa = 6.83SADD76 pKa = 3.2SGAASGDD83 pKa = 3.7SGVGEE88 pKa = 4.64DD89 pKa = 4.06LVEE92 pKa = 4.2VNLDD96 pKa = 3.89LKK98 pKa = 10.84CYY100 pKa = 10.54EE101 pKa = 4.51EE102 pKa = 4.61GLPPSGSEE110 pKa = 3.46ADD112 pKa = 3.68EE113 pKa = 4.48AEE115 pKa = 4.04EE116 pKa = 3.75RR117 pKa = 11.84AEE119 pKa = 4.08EE120 pKa = 4.31EE121 pKa = 3.89EE122 pKa = 4.53TAVSNYY128 pKa = 9.45VNIAEE133 pKa = 4.64GASQLVLDD141 pKa = 4.83CPEE144 pKa = 4.02NPGRR148 pKa = 11.84GCRR151 pKa = 11.84ACDD154 pKa = 3.49FHH156 pKa = 8.58RR157 pKa = 11.84GSSGNPEE164 pKa = 4.02AMCALCYY171 pKa = 9.74MRR173 pKa = 11.84LTGHH177 pKa = 7.36CIYY180 pKa = 11.01SPISDD185 pKa = 4.11AEE187 pKa = 4.65GEE189 pKa = 4.54CEE191 pKa = 4.16LGSNEE196 pKa = 4.15EE197 pKa = 4.33TEE199 pKa = 4.82LPCSLTATAPVRR211 pKa = 11.84PTPCRR216 pKa = 11.84VSCRR220 pKa = 11.84RR221 pKa = 11.84RR222 pKa = 11.84PAVDD226 pKa = 4.25CIEE229 pKa = 4.89DD230 pKa = 4.01LLEE233 pKa = 4.6EE234 pKa = 5.07DD235 pKa = 4.52PTDD238 pKa = 3.6EE239 pKa = 4.98PLNLSLKK246 pKa = 10.08RR247 pKa = 11.84PKK249 pKa = 10.63SSS251 pKa = 2.91
Molecular weight: 27.48 kDa
Isoelectric point according different methods:
Protein with the highest isoelectric point:
>tr|B5SNU1|B5SNU1_ADE41 Control protein E4orf2 OS=Human adenovirus F serotype 41 OX=10524 PE=4 SV=1
MM1 pKa = 7.75ALTCRR6 pKa = 11.84FRR8 pKa = 11.84IPVSSYY14 pKa = 9.26RR15 pKa = 11.84GRR17 pKa = 11.84SRR19 pKa = 11.84RR20 pKa = 11.84RR21 pKa = 11.84RR22 pKa = 11.84GMLGSGRR29 pKa = 11.84RR30 pKa = 11.84RR31 pKa = 11.84ALRR34 pKa = 11.84RR35 pKa = 11.84RR36 pKa = 11.84MKK38 pKa = 10.76GGFLPALIPIIAAAIGAIPGIASVALQARR67 pKa = 11.84KK68 pKa = 7.68QQ69 pKa = 3.39
MM1 pKa = 7.75ALTCRR6 pKa = 11.84FRR8 pKa = 11.84IPVSSYY14 pKa = 9.26RR15 pKa = 11.84GRR17 pKa = 11.84SRR19 pKa = 11.84RR20 pKa = 11.84RR21 pKa = 11.84RR22 pKa = 11.84GMLGSGRR29 pKa = 11.84RR30 pKa = 11.84RR31 pKa = 11.84ALRR34 pKa = 11.84RR35 pKa = 11.84RR36 pKa = 11.84MKK38 pKa = 10.76GGFLPALIPIIAAAIGAIPGIASVALQARR67 pKa = 11.84KK68 pKa = 7.68QQ69 pKa = 3.39
Molecular weight: 7.59 kDa
Isoelectric point according different methods:
Peptides (in silico digests for buttom-up proteomics)
Below you can find in silico digests of the whole proteome with Trypsin, Chymotrypsin, Trypsin+LysC, LysN, ArgC proteases suitable for different mass spec machines.| Try ESI |
 |
|---|
| ChTry ESI |
|
|---|
| ArgC ESI |
|
|---|
| LysN ESI |
|
|---|
| TryLysC ESI |
|
|---|
| Try MALDI |
|
|---|
| ChTry MALDI |
|
|---|
| ArgC MALDI |
|
|---|
| LysN MALDI |
|
|---|
| TryLysC MALDI |
|
|---|
| Try LTQ |
|
|---|
| ChTry LTQ |
|
|---|
| ArgC LTQ |
|
|---|
| LysN LTQ |
|
|---|
| TryLysC LTQ |
|
|---|
| Try MSlow |
|
|---|
| ChTry MSlow |
|
|---|
| ArgC MSlow |
|
|---|
| LysN MSlow |
|
|---|
| TryLysC MSlow |
|
|---|
| Try MShigh |
|
|---|
| ChTry MShigh |
|
|---|
| ArgC MShigh |
|
|---|
| LysN MShigh |
|
|---|
| TryLysC MShigh |
|
|---|
General Statistics
Number of major isoforms |
Number of additional isoforms |
Number of all proteins |
Number of amino acids |
Min. Seq. Length |
Max. Seq. Length |
Avg. Seq. Length |
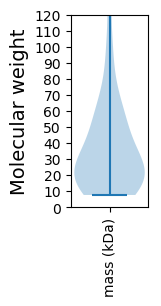
Avg. Mol. Weight |
|---|---|---|---|---|---|---|---|
11321 |
69 |
1187 |
333.0 |
37.43 |
Amino acid frequency
Ala |
Cys |
Asp |
Glu |
Phe |
Gly |
His |
Ile |
Lys |
Leu |
|---|---|---|---|---|---|---|---|---|---|
7.605 ± 0.37 | 1.811 ± 0.283 |
4.549 ± 0.258 | 6.245 ± 0.518 |
3.931 ± 0.215 | 5.927 ± 0.239 |
1.97 ± 0.208 | 4.046 ± 0.206 |
3.887 ± 0.346 | 10.061 ± 0.467 |
Met |
Asn |
Gln |
Pro |
Arg |
Ser |
Thr |
Val |
Trp |
Tyr |
|---|---|---|---|---|---|---|---|---|---|
2.394 ± 0.179 | 5.035 ± 0.437 |
6.607 ± 0.233 | 4.761 ± 0.278 |
7.075 ± 0.574 | 7.084 ± 0.322 |
5.971 ± 0.34 | 6.263 ± 0.246 |
1.378 ± 0.111 | 3.401 ± 0.287 |
Most of the basic statistics you can see at this page can be downloaded from this CSV file
See this proteome in:

Proteome-pI is available under Creative Commons Attribution-NoDerivs license, for more details see here
| Reference: Kozlowski LP. Proteome-pI 2.0: Proteome Isoelectric Point Database Update. Nucleic Acids Res. 2021, doi: 10.1093/nar/gkab944 | Contact: Lukasz P. Kozlowski |