Vibrio virus fs1
Taxonomy: Viruses; Monodnaviria; Loebvirae; Hofneiviricota; Faserviricetes; Tubulavirales; Inoviridae; Fibrovirus
Average proteome isoelectric point is 6.98
Get precalculated fractions of proteins
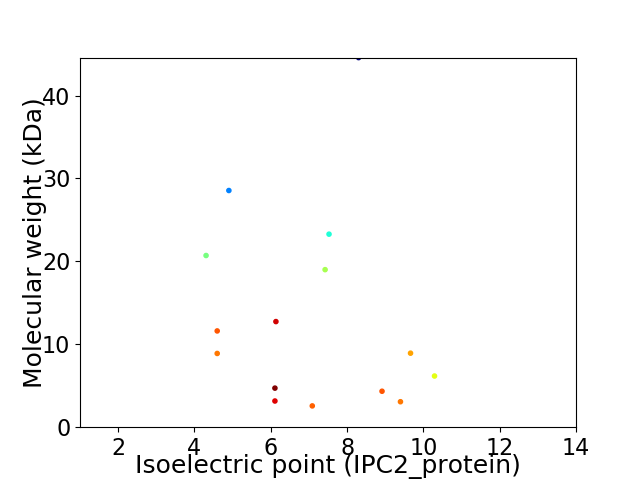
Virtual 2D-PAGE plot for 15 proteins (isoelectric point calculated using IPC2_protein)
Get csv file with sequences according to given criteria:
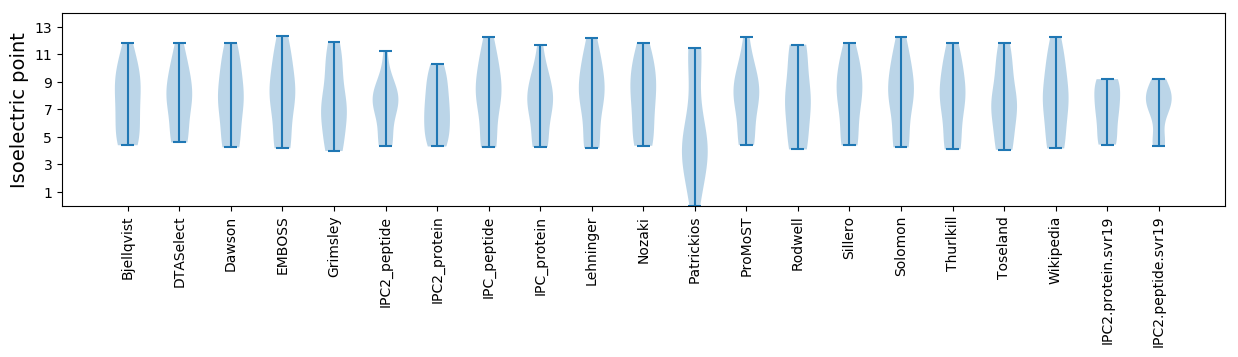
* You can choose from 21 different methods for calculating isoelectric point
Summary statistics related to proteome-wise predictions
Protein with the lowest isoelectric point:
>tr|O56849|O56849_9VIRU Uncharacterized protein OS=Vibrio virus fs1 OX=70203 PE=4 SV=1
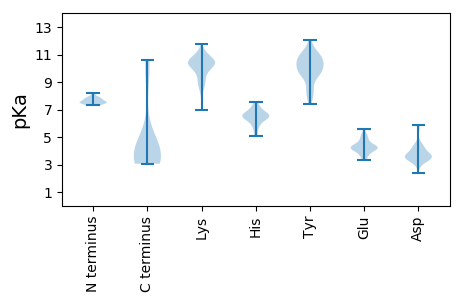
MM1 pKa = 7.51PVCALPNSQGFLAVTDD17 pKa = 4.27KK18 pKa = 10.95PLNEE22 pKa = 4.31CDD24 pKa = 3.24GGYY27 pKa = 10.23VAVTIQDD34 pKa = 3.3YY35 pKa = 10.53DD36 pKa = 3.69YY37 pKa = 11.27LMSYY41 pKa = 8.66TRR43 pKa = 11.84ITPTDD48 pKa = 3.19AGTAFSFGFMAVFALGYY65 pKa = 9.32LYY67 pKa = 10.33TYY69 pKa = 10.88AVYY72 pKa = 10.17IGKK75 pKa = 9.83KK76 pKa = 10.08LINLLL81 pKa = 3.88
MM1 pKa = 7.51PVCALPNSQGFLAVTDD17 pKa = 4.27KK18 pKa = 10.95PLNEE22 pKa = 4.31CDD24 pKa = 3.24GGYY27 pKa = 10.23VAVTIQDD34 pKa = 3.3YY35 pKa = 10.53DD36 pKa = 3.69YY37 pKa = 11.27LMSYY41 pKa = 8.66TRR43 pKa = 11.84ITPTDD48 pKa = 3.19AGTAFSFGFMAVFALGYY65 pKa = 9.32LYY67 pKa = 10.33TYY69 pKa = 10.88AVYY72 pKa = 10.17IGKK75 pKa = 9.83KK76 pKa = 10.08LINLLL81 pKa = 3.88
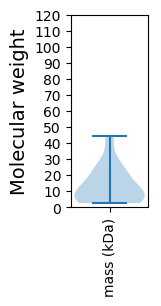
Molecular weight: 8.89 kDa
Isoelectric point according different methods:
Protein with the highest isoelectric point:
>tr|O56842|O56842_9VIRU Uncharacterized protein OS=Vibrio virus fs1 OX=70203 PE=4 SV=1
MM1 pKa = 7.85IINTLAPEE9 pKa = 5.2KK10 pKa = 10.6IPFALPSHH18 pKa = 6.26KK19 pKa = 10.25RR20 pKa = 11.84CFSKK24 pKa = 10.68RR25 pKa = 11.84SSS27 pKa = 3.13
MM1 pKa = 7.85IINTLAPEE9 pKa = 5.2KK10 pKa = 10.6IPFALPSHH18 pKa = 6.26KK19 pKa = 10.25RR20 pKa = 11.84CFSKK24 pKa = 10.68RR25 pKa = 11.84SSS27 pKa = 3.13
Molecular weight: 3.07 kDa
Isoelectric point according different methods:
Peptides (in silico digests for buttom-up proteomics)
Below you can find in silico digests of the whole proteome with Trypsin, Chymotrypsin, Trypsin+LysC, LysN, ArgC proteases suitable for different mass spec machines.| Try ESI |
 |
|---|
| ChTry ESI |
|
|---|
| ArgC ESI |
|
|---|
| LysN ESI |
|
|---|
| TryLysC ESI |
|
|---|
| Try MALDI |
|
|---|
| ChTry MALDI |
|
|---|
| ArgC MALDI |
|
|---|
| LysN MALDI |
|
|---|
| TryLysC MALDI |
|
|---|
| Try LTQ |
|
|---|
| ChTry LTQ |
|
|---|
| ArgC LTQ |
|
|---|
| LysN LTQ |
|
|---|
| TryLysC LTQ |
|
|---|
| Try MSlow |
|
|---|
| ChTry MSlow |
|
|---|
| ArgC MSlow |
|
|---|
| LysN MSlow |
|
|---|
| TryLysC MSlow |
|
|---|
| Try MShigh |
|
|---|
| ChTry MShigh |
|
|---|
| ArgC MShigh |
|
|---|
| LysN MShigh |
|
|---|
| TryLysC MShigh |
|
|---|
General Statistics
Number of major isoforms |
Number of additional isoforms |
Number of all proteins |
Number of amino acids |
Min. Seq. Length |
Max. Seq. Length |
Avg. Seq. Length |
Avg. Mol. Weight |
|---|---|---|---|---|---|---|---|
0 |
1804 |
20 |
384 |
120.3 |
13.49 |
Amino acid frequency
Ala |
Cys |
Asp |
Glu |
Phe |
Gly |
His |
Ile |
Lys |
Leu |
|---|---|---|---|---|---|---|---|---|---|
6.929 ± 0.78 | 1.829 ± 0.394 |
5.71 ± 0.56 | 4.268 ± 0.607 |
4.989 ± 0.525 | 5.82 ± 0.51 |
1.996 ± 0.642 | 7.761 ± 0.797 |
6.375 ± 0.514 | 9.035 ± 1.157 |
Met |
Asn |
Gln |
Pro |
Arg |
Ser |
Thr |
Val |
Trp |
Tyr |
|---|---|---|---|---|---|---|---|---|---|
2.882 ± 0.482 | 4.435 ± 0.633 |
5.765 ± 0.665 | 3.991 ± 0.481 |
4.157 ± 0.642 | 7.151 ± 0.831 |
6.098 ± 0.671 | 5.931 ± 0.377 |
1.109 ± 0.271 | 3.769 ± 0.796 |
Most of the basic statistics you can see at this page can be downloaded from this CSV file
See this proteome in:

Proteome-pI is available under Creative Commons Attribution-NoDerivs license, for more details see here
| Reference: Kozlowski LP. Proteome-pI 2.0: Proteome Isoelectric Point Database Update. Nucleic Acids Res. 2021, doi: 10.1093/nar/gkab944 | Contact: Lukasz P. Kozlowski |