Acinetobacter phage AP22
Taxonomy: Viruses; Duplodnaviria; Heunggongvirae; Uroviricota; Caudoviricetes; Caudovirales; Myoviridae; Obolenskvirus; Acinetobacter virus AP22
Average proteome isoelectric point is 6.23
Get precalculated fractions of proteins
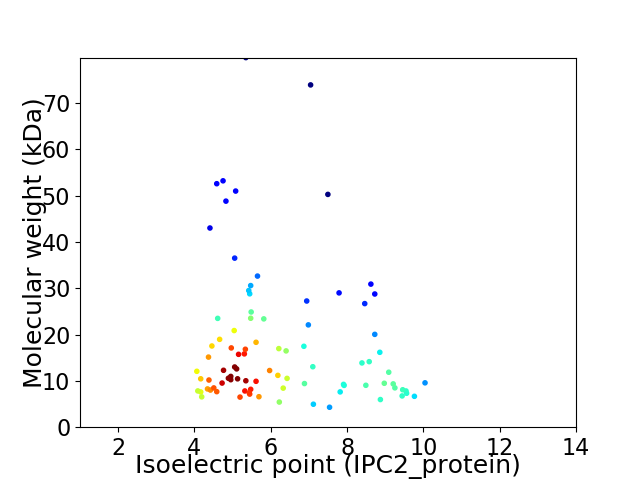
Virtual 2D-PAGE plot for 89 proteins (isoelectric point calculated using IPC2_protein)
Get csv file with sequences according to given criteria:
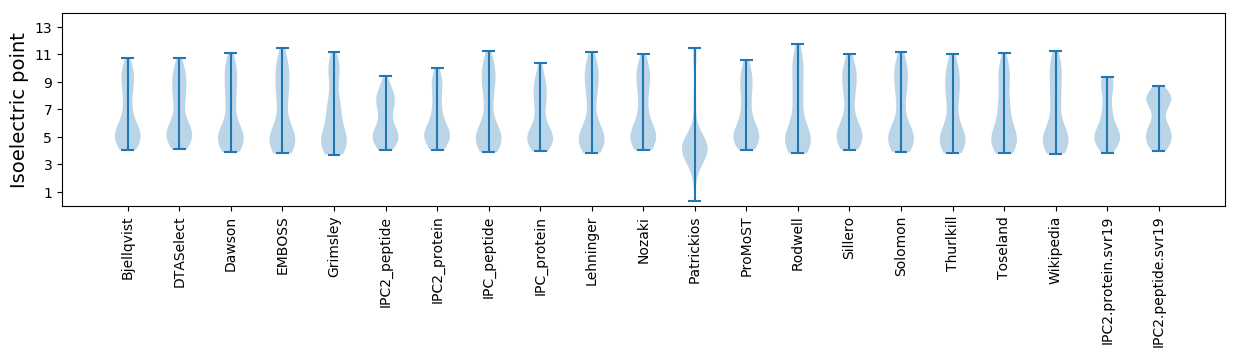
* You can choose from 21 different methods for calculating isoelectric point
Summary statistics related to proteome-wise predictions
Protein with the lowest isoelectric point:
>tr|I2GUF4|I2GUF4_9CAUD Uncharacterized protein OS=Acinetobacter phage AP22 OX=1187128 PE=4 SV=1
MM1 pKa = 7.25AQYY4 pKa = 9.85DD5 pKa = 3.73IPLAQVPNQFFTTSLNGVTWAITLEE30 pKa = 4.08TRR32 pKa = 11.84LNNLYY37 pKa = 10.27ISLSNNNDD45 pKa = 2.72GDD47 pKa = 3.93VLLNRR52 pKa = 11.84ICLNRR57 pKa = 11.84TYY59 pKa = 10.63LGRR62 pKa = 11.84GFIFVDD68 pKa = 2.96IDD70 pKa = 3.79GNSDD74 pKa = 3.53PEE76 pKa = 4.25YY77 pKa = 9.62TGLGTRR83 pKa = 11.84YY84 pKa = 10.14LLIWTDD90 pKa = 3.71EE91 pKa = 4.13VV92 pKa = 3.51
MM1 pKa = 7.25AQYY4 pKa = 9.85DD5 pKa = 3.73IPLAQVPNQFFTTSLNGVTWAITLEE30 pKa = 4.08TRR32 pKa = 11.84LNNLYY37 pKa = 10.27ISLSNNNDD45 pKa = 2.72GDD47 pKa = 3.93VLLNRR52 pKa = 11.84ICLNRR57 pKa = 11.84TYY59 pKa = 10.63LGRR62 pKa = 11.84GFIFVDD68 pKa = 2.96IDD70 pKa = 3.79GNSDD74 pKa = 3.53PEE76 pKa = 4.25YY77 pKa = 9.62TGLGTRR83 pKa = 11.84YY84 pKa = 10.14LLIWTDD90 pKa = 3.71EE91 pKa = 4.13VV92 pKa = 3.51
Molecular weight: 10.45 kDa
Isoelectric point according different methods:
Protein with the highest isoelectric point:
>tr|I2GUD2|I2GUD2_9CAUD DnaJ-class molecular chaperone with C-terminal Zn finger domain putative OS=Acinetobacter phage AP22 OX=1187128 PE=4 SV=1
MM1 pKa = 7.53SNKK4 pKa = 7.83QTWLQSHH11 pKa = 6.93AEE13 pKa = 4.13TLTQNIVGLLIGFIILKK30 pKa = 10.24CFGLSASEE38 pKa = 4.29SVQLQAVIFATSYY51 pKa = 10.74LRR53 pKa = 11.84SFLIRR58 pKa = 11.84RR59 pKa = 11.84FFNRR63 pKa = 11.84FVGSQPP69 pKa = 3.23
MM1 pKa = 7.53SNKK4 pKa = 7.83QTWLQSHH11 pKa = 6.93AEE13 pKa = 4.13TLTQNIVGLLIGFIILKK30 pKa = 10.24CFGLSASEE38 pKa = 4.29SVQLQAVIFATSYY51 pKa = 10.74LRR53 pKa = 11.84SFLIRR58 pKa = 11.84RR59 pKa = 11.84FFNRR63 pKa = 11.84FVGSQPP69 pKa = 3.23
Molecular weight: 7.82 kDa
Isoelectric point according different methods:
Peptides (in silico digests for buttom-up proteomics)
Below you can find in silico digests of the whole proteome with Trypsin, Chymotrypsin, Trypsin+LysC, LysN, ArgC proteases suitable for different mass spec machines.| Try ESI |
 |
|---|
| ChTry ESI |
|
|---|
| ArgC ESI |
|
|---|
| LysN ESI |
|
|---|
| TryLysC ESI |
|
|---|
| Try MALDI |
|
|---|
| ChTry MALDI |
|
|---|
| ArgC MALDI |
|
|---|
| LysN MALDI |
|
|---|
| TryLysC MALDI |
|
|---|
| Try LTQ |
|
|---|
| ChTry LTQ |
|
|---|
| ArgC LTQ |
|
|---|
| LysN LTQ |
|
|---|
| TryLysC LTQ |
|
|---|
| Try MSlow |
|
|---|
| ChTry MSlow |
|
|---|
| ArgC MSlow |
|
|---|
| LysN MSlow |
|
|---|
| TryLysC MSlow |
|
|---|
| Try MShigh |
|
|---|
| ChTry MShigh |
|
|---|
| ArgC MShigh |
|
|---|
| LysN MShigh |
|
|---|
| TryLysC MShigh |
|
|---|
General Statistics
Number of major isoforms |
Number of additional isoforms |
Number of all proteins |
Number of amino acids |
Min. Seq. Length |
Max. Seq. Length |
Avg. Seq. Length |
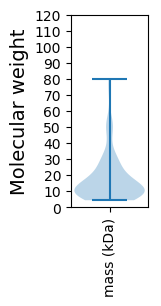
Avg. Mol. Weight |
|---|---|---|---|---|---|---|---|
0 |
14104 |
37 |
727 |
158.5 |
17.85 |
Amino acid frequency
Ala |
Cys |
Asp |
Glu |
Phe |
Gly |
His |
Ile |
Lys |
Leu |
|---|---|---|---|---|---|---|---|---|---|
6.955 ± 0.363 | 1.227 ± 0.154 |
6.168 ± 0.262 | 6.686 ± 0.339 |
4.424 ± 0.235 | 7.033 ± 0.247 |
1.652 ± 0.152 | 6.92 ± 0.251 |
7.679 ± 0.389 | 8.26 ± 0.267 |
Met |
Asn |
Gln |
Pro |
Arg |
Ser |
Thr |
Val |
Trp |
Tyr |
|---|---|---|---|---|---|---|---|---|---|
2.914 ± 0.19 | 5.885 ± 0.33 |
3.191 ± 0.151 | 3.8 ± 0.254 |
3.701 ± 0.185 | 6.246 ± 0.231 |
5.282 ± 0.303 | 6.573 ± 0.246 |
1.553 ± 0.112 | 3.85 ± 0.164 |
Most of the basic statistics you can see at this page can be downloaded from this CSV file
See this proteome in:

Proteome-pI is available under Creative Commons Attribution-NoDerivs license, for more details see here
| Reference: Kozlowski LP. Proteome-pI 2.0: Proteome Isoelectric Point Database Update. Nucleic Acids Res. 2021, doi: 10.1093/nar/gkab944 | Contact: Lukasz P. Kozlowski |