Escherichia phage ST20
Taxonomy: Viruses; Duplodnaviria; Heunggongvirae; Uroviricota; Caudoviricetes; Caudovirales; Siphoviridae; Guernseyvirinae; Kagunavirus; unclassified Kagunavirus
Average proteome isoelectric point is 6.2
Get precalculated fractions of proteins
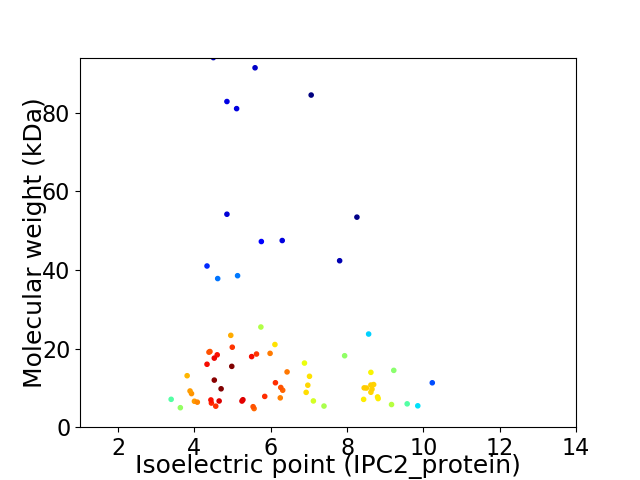
Virtual 2D-PAGE plot for 72 proteins (isoelectric point calculated using IPC2_protein)
Get csv file with sequences according to given criteria:
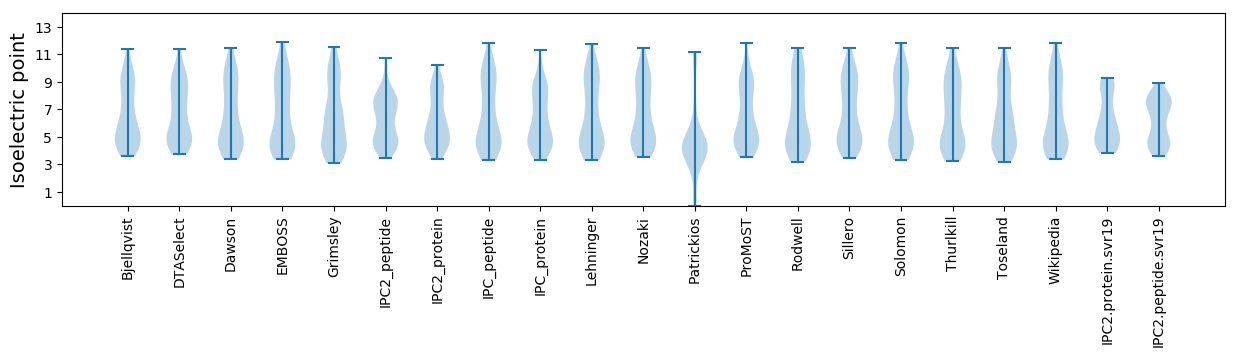
* You can choose from 21 different methods for calculating isoelectric point
Summary statistics related to proteome-wise predictions
Protein with the lowest isoelectric point:
>tr|A0A220IH85|A0A220IH85_9CAUD Uncharacterized protein OS=Escherichia phage ST20 OX=2569975 PE=4 SV=1
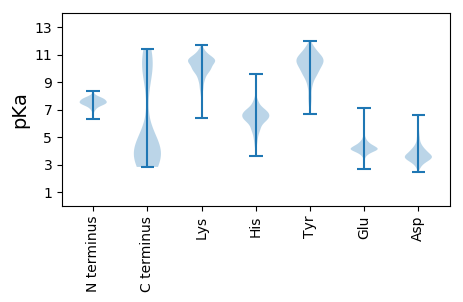
MM1 pKa = 7.41GEE3 pKa = 3.81WVKK6 pKa = 10.83CSEE9 pKa = 4.29RR10 pKa = 11.84MPDD13 pKa = 3.25AEE15 pKa = 4.17VSVLVTDD22 pKa = 4.54GSVVIISSYY31 pKa = 11.65NGFDD35 pKa = 2.8WVDD38 pKa = 3.73YY39 pKa = 10.18YY40 pKa = 9.47WTEE43 pKa = 4.31FATHH47 pKa = 6.66WMPLPEE53 pKa = 4.67PPEE56 pKa = 3.97VV57 pKa = 3.36
MM1 pKa = 7.41GEE3 pKa = 3.81WVKK6 pKa = 10.83CSEE9 pKa = 4.29RR10 pKa = 11.84MPDD13 pKa = 3.25AEE15 pKa = 4.17VSVLVTDD22 pKa = 4.54GSVVIISSYY31 pKa = 11.65NGFDD35 pKa = 2.8WVDD38 pKa = 3.73YY39 pKa = 10.18YY40 pKa = 9.47WTEE43 pKa = 4.31FATHH47 pKa = 6.66WMPLPEE53 pKa = 4.67PPEE56 pKa = 3.97VV57 pKa = 3.36
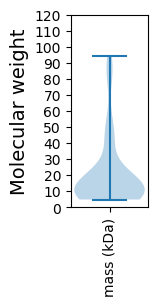
Molecular weight: 6.6 kDa
Isoelectric point according different methods:
Protein with the highest isoelectric point:
>tr|A0A220IH92|A0A220IH92_9CAUD Uncharacterized protein OS=Escherichia phage ST20 OX=2569975 PE=4 SV=1
MM1 pKa = 7.78RR2 pKa = 11.84EE3 pKa = 3.91AFEE6 pKa = 3.82RR7 pKa = 11.84WAVVEE12 pKa = 3.95GLPVNKK18 pKa = 9.95GSKK21 pKa = 9.82KK22 pKa = 9.54EE23 pKa = 3.94YY24 pKa = 9.84LNVRR28 pKa = 11.84TRR30 pKa = 11.84LAWRR34 pKa = 11.84AWKK37 pKa = 10.53AGVLSVANPRR47 pKa = 3.61
MM1 pKa = 7.78RR2 pKa = 11.84EE3 pKa = 3.91AFEE6 pKa = 3.82RR7 pKa = 11.84WAVVEE12 pKa = 3.95GLPVNKK18 pKa = 9.95GSKK21 pKa = 9.82KK22 pKa = 9.54EE23 pKa = 3.94YY24 pKa = 9.84LNVRR28 pKa = 11.84TRR30 pKa = 11.84LAWRR34 pKa = 11.84AWKK37 pKa = 10.53AGVLSVANPRR47 pKa = 3.61
Molecular weight: 5.44 kDa
Isoelectric point according different methods:
Peptides (in silico digests for buttom-up proteomics)
Below you can find in silico digests of the whole proteome with Trypsin, Chymotrypsin, Trypsin+LysC, LysN, ArgC proteases suitable for different mass spec machines.| Try ESI |
 |
|---|
| ChTry ESI |
|
|---|
| ArgC ESI |
|
|---|
| LysN ESI |
|
|---|
| TryLysC ESI |
|
|---|
| Try MALDI |
|
|---|
| ChTry MALDI |
|
|---|
| ArgC MALDI |
|
|---|
| LysN MALDI |
|
|---|
| TryLysC MALDI |
|
|---|
| Try LTQ |
|
|---|
| ChTry LTQ |
|
|---|
| ArgC LTQ |
|
|---|
| LysN LTQ |
|
|---|
| TryLysC LTQ |
|
|---|
| Try MSlow |
|
|---|
| ChTry MSlow |
|
|---|
| ArgC MSlow |
|
|---|
| LysN MSlow |
|
|---|
| TryLysC MSlow |
|
|---|
| Try MShigh |
|
|---|
| ChTry MShigh |
|
|---|
| ArgC MShigh |
|
|---|
| LysN MShigh |
|
|---|
| TryLysC MShigh |
|
|---|
General Statistics
Number of major isoforms |
Number of additional isoforms |
Number of all proteins |
Number of amino acids |
Min. Seq. Length |
Max. Seq. Length |
Avg. Seq. Length |
Avg. Mol. Weight |
|---|---|---|---|---|---|---|---|
0 |
13317 |
42 |
852 |
185.0 |
20.49 |
Amino acid frequency
Ala |
Cys |
Asp |
Glu |
Phe |
Gly |
His |
Ile |
Lys |
Leu |
|---|---|---|---|---|---|---|---|---|---|
9.754 ± 0.533 | 1.104 ± 0.129 |
6.435 ± 0.236 | 6.954 ± 0.4 |
3.702 ± 0.152 | 7.577 ± 0.247 |
1.569 ± 0.175 | 5.482 ± 0.185 |
5.85 ± 0.37 | 7.509 ± 0.282 |
Met |
Asn |
Gln |
Pro |
Arg |
Ser |
Thr |
Val |
Trp |
Tyr |
|---|---|---|---|---|---|---|---|---|---|
2.448 ± 0.161 | 4.265 ± 0.209 |
3.852 ± 0.209 | 3.672 ± 0.296 |
5.317 ± 0.246 | 5.85 ± 0.34 |
6.495 ± 0.432 | 7.096 ± 0.281 |
1.412 ± 0.126 | 3.657 ± 0.221 |
Most of the basic statistics you can see at this page can be downloaded from this CSV file
See this proteome in:

Proteome-pI is available under Creative Commons Attribution-NoDerivs license, for more details see here
| Reference: Kozlowski LP. Proteome-pI 2.0: Proteome Isoelectric Point Database Update. Nucleic Acids Res. 2021, doi: 10.1093/nar/gkab944 | Contact: Lukasz P. Kozlowski |