Podoviridae sp. ct2cs2
Taxonomy: Viruses; Duplodnaviria; Heunggongvirae; Uroviricota; Caudoviricetes; Caudovirales; Podoviridae; unclassified Podoviridae
Average proteome isoelectric point is 6.18
Get precalculated fractions of proteins
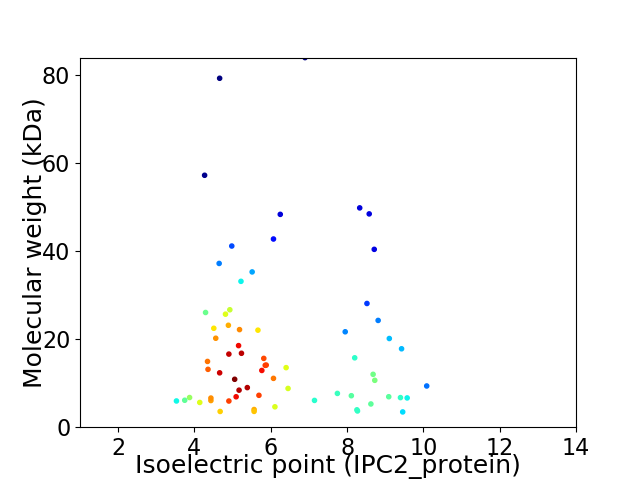
Virtual 2D-PAGE plot for 68 proteins (isoelectric point calculated using IPC2_protein)
Get csv file with sequences according to given criteria:
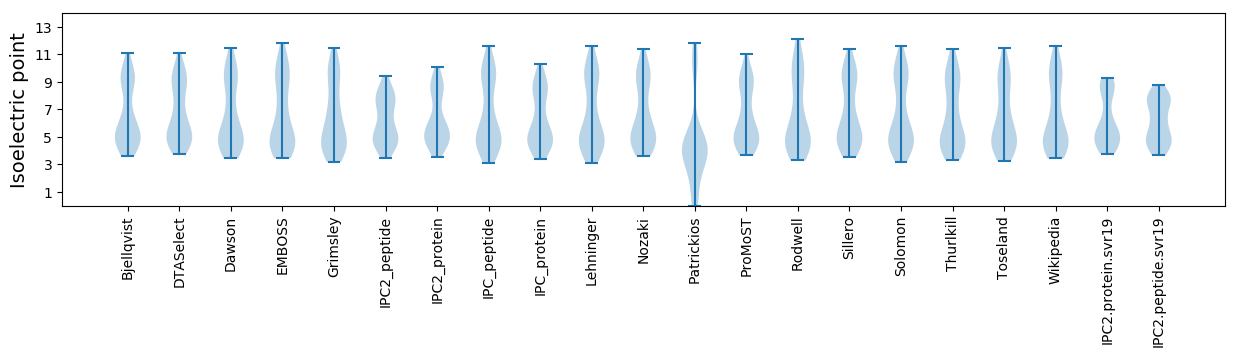
* You can choose from 21 different methods for calculating isoelectric point
Summary statistics related to proteome-wise predictions
Protein with the lowest isoelectric point:
>tr|A0A5Q2W5W6|A0A5Q2W5W6_9CAUD Tail fiber adhesin OS=Podoviridae sp. ct2cs2 OX=2656707 PE=4 SV=1
MM1 pKa = 7.41QIEE4 pKa = 4.79LDD6 pKa = 4.1YY7 pKa = 10.65ITEE10 pKa = 4.26ALHH13 pKa = 7.47AIDD16 pKa = 6.28LNLEE20 pKa = 4.07DD21 pKa = 4.29VNRR24 pKa = 11.84GITPSGYY31 pKa = 8.59LTINQYY37 pKa = 11.07LDD39 pKa = 3.22DD40 pKa = 3.9MRR42 pKa = 11.84YY43 pKa = 9.04QLSEE47 pKa = 4.38LNTEE51 pKa = 4.24ISNLEE56 pKa = 3.96INN58 pKa = 4.0
MM1 pKa = 7.41QIEE4 pKa = 4.79LDD6 pKa = 4.1YY7 pKa = 10.65ITEE10 pKa = 4.26ALHH13 pKa = 7.47AIDD16 pKa = 6.28LNLEE20 pKa = 4.07DD21 pKa = 4.29VNRR24 pKa = 11.84GITPSGYY31 pKa = 8.59LTINQYY37 pKa = 11.07LDD39 pKa = 3.22DD40 pKa = 3.9MRR42 pKa = 11.84YY43 pKa = 9.04QLSEE47 pKa = 4.38LNTEE51 pKa = 4.24ISNLEE56 pKa = 3.96INN58 pKa = 4.0
Molecular weight: 6.73 kDa
Isoelectric point according different methods:
Protein with the highest isoelectric point:
>tr|A0A5Q2W272|A0A5Q2W272_9CAUD Endolysin OS=Podoviridae sp. ct2cs2 OX=2656707 PE=3 SV=1
MM1 pKa = 6.83THH3 pKa = 5.09YY4 pKa = 10.54QIRR7 pKa = 11.84KK8 pKa = 4.79QWRR11 pKa = 11.84IKK13 pKa = 10.54LHH15 pKa = 6.57AKK17 pKa = 9.35RR18 pKa = 11.84CKK20 pKa = 10.91DD21 pKa = 3.06NDD23 pKa = 3.41QSTEE27 pKa = 3.76RR28 pKa = 11.84YY29 pKa = 9.45KK30 pKa = 10.78RR31 pKa = 11.84DD32 pKa = 3.13AKK34 pKa = 10.9VLNRR38 pKa = 11.84CMSIYY43 pKa = 10.29KK44 pKa = 9.94IEE46 pKa = 4.23GTRR49 pKa = 11.84ATWGQQ54 pKa = 3.14
MM1 pKa = 6.83THH3 pKa = 5.09YY4 pKa = 10.54QIRR7 pKa = 11.84KK8 pKa = 4.79QWRR11 pKa = 11.84IKK13 pKa = 10.54LHH15 pKa = 6.57AKK17 pKa = 9.35RR18 pKa = 11.84CKK20 pKa = 10.91DD21 pKa = 3.06NDD23 pKa = 3.41QSTEE27 pKa = 3.76RR28 pKa = 11.84YY29 pKa = 9.45KK30 pKa = 10.78RR31 pKa = 11.84DD32 pKa = 3.13AKK34 pKa = 10.9VLNRR38 pKa = 11.84CMSIYY43 pKa = 10.29KK44 pKa = 9.94IEE46 pKa = 4.23GTRR49 pKa = 11.84ATWGQQ54 pKa = 3.14
Molecular weight: 6.64 kDa
Isoelectric point according different methods:
Peptides (in silico digests for buttom-up proteomics)
Below you can find in silico digests of the whole proteome with Trypsin, Chymotrypsin, Trypsin+LysC, LysN, ArgC proteases suitable for different mass spec machines.| Try ESI |
 |
|---|
| ChTry ESI |
|
|---|
| ArgC ESI |
|
|---|
| LysN ESI |
|
|---|
| TryLysC ESI |
|
|---|
| Try MALDI |
|
|---|
| ChTry MALDI |
|
|---|
| ArgC MALDI |
|
|---|
| LysN MALDI |
|
|---|
| TryLysC MALDI |
|
|---|
| Try LTQ |
|
|---|
| ChTry LTQ |
|
|---|
| ArgC LTQ |
|
|---|
| LysN LTQ |
|
|---|
| TryLysC LTQ |
|
|---|
| Try MSlow |
|
|---|
| ChTry MSlow |
|
|---|
| ArgC MSlow |
|
|---|
| LysN MSlow |
|
|---|
| TryLysC MSlow |
|
|---|
| Try MShigh |
|
|---|
| ChTry MShigh |
|
|---|
| ArgC MShigh |
|
|---|
| LysN MShigh |
|
|---|
| TryLysC MShigh |
|
|---|
General Statistics
Number of major isoforms |
Number of additional isoforms |
Number of all proteins |
Number of amino acids |
Min. Seq. Length |
Max. Seq. Length |
Avg. Seq. Length |
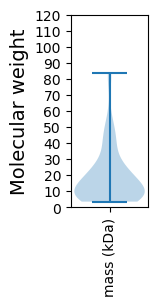
Avg. Mol. Weight |
|---|---|---|---|---|---|---|---|
0 |
11624 |
30 |
785 |
170.9 |
18.89 |
Amino acid frequency
Ala |
Cys |
Asp |
Glu |
Phe |
Gly |
His |
Ile |
Lys |
Leu |
|---|---|---|---|---|---|---|---|---|---|
8.379 ± 0.551 | 1.067 ± 0.169 |
5.136 ± 0.285 | 5.936 ± 0.606 |
3.734 ± 0.233 | 7.528 ± 0.623 |
1.394 ± 0.228 | 6.237 ± 0.253 |
6.005 ± 0.539 | 7.614 ± 0.414 |
Met |
Asn |
Gln |
Pro |
Arg |
Ser |
Thr |
Val |
Trp |
Tyr |
|---|---|---|---|---|---|---|---|---|---|
2.392 ± 0.202 | 5.945 ± 0.39 |
3.484 ± 0.251 | 4.181 ± 0.35 |
4.069 ± 0.282 | 7.416 ± 0.55 |
8.173 ± 0.705 | 5.893 ± 0.262 |
1.316 ± 0.166 | 4.104 ± 0.23 |
Most of the basic statistics you can see at this page can be downloaded from this CSV file
See this proteome in:

Proteome-pI is available under Creative Commons Attribution-NoDerivs license, for more details see here
| Reference: Kozlowski LP. Proteome-pI 2.0: Proteome Isoelectric Point Database Update. Nucleic Acids Res. 2021, doi: 10.1093/nar/gkab944 | Contact: Lukasz P. Kozlowski |