Vibrio phage VCY-phi
Taxonomy: Viruses; Monodnaviria; Loebvirae; Hofneiviricota; Faserviricetes; Tubulavirales; Inoviridae; Vicialiavirus; Vibrio virus VCY
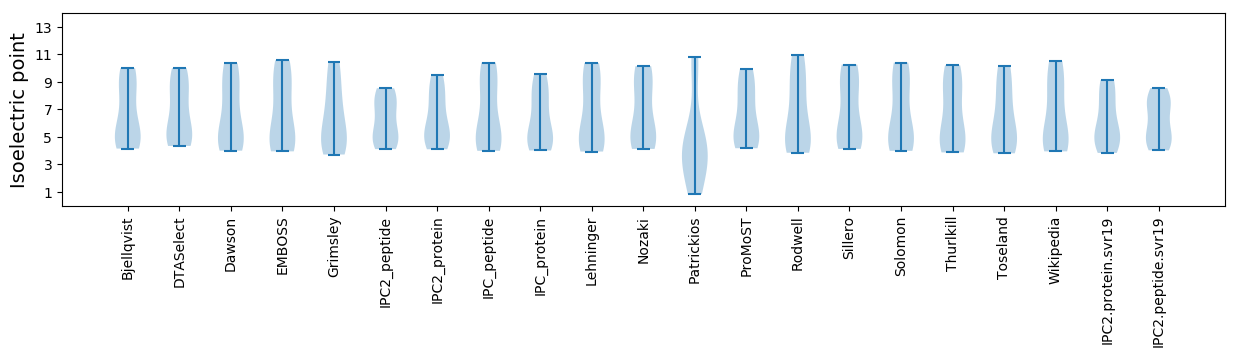
Average proteome isoelectric point is 6.22
Get precalculated fractions of proteins
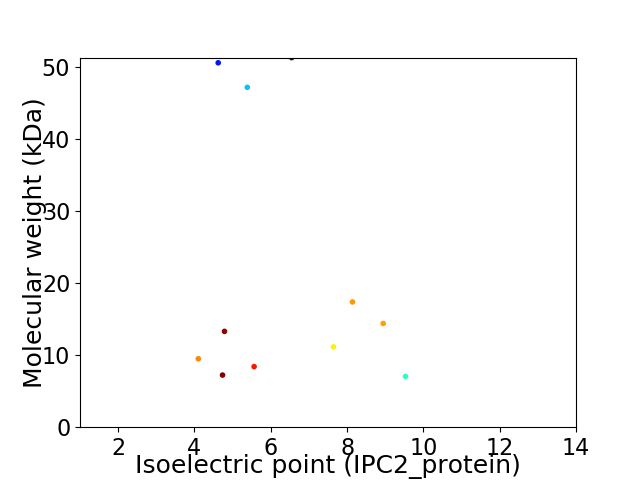
Virtual 2D-PAGE plot for 11 proteins (isoelectric point calculated using IPC2_protein)
Get csv file with sequences according to given criteria:
* You can choose from 21 different methods for calculating isoelectric point
Summary statistics related to proteome-wise predictions
Protein with the lowest isoelectric point:
>tr|G8IRU5|G8IRU5_9VIRU DNA replication initiation protein OS=Vibrio phage VCY-phi OX=1105327 PE=4 SV=1
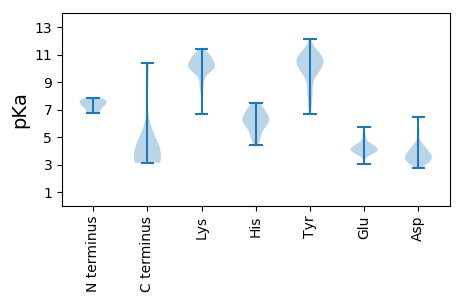
MM1 pKa = 7.64ANMVIRR7 pKa = 11.84FGDD10 pKa = 3.89SHH12 pKa = 6.08WTTVMIKK19 pKa = 10.28NSPVYY24 pKa = 9.91YY25 pKa = 8.81WQEE28 pKa = 3.42SDD30 pKa = 3.9GYY32 pKa = 8.25YY33 pKa = 10.15VCIDD37 pKa = 3.33GRR39 pKa = 11.84PDD41 pKa = 3.66FFNTSTEE48 pKa = 4.02MYY50 pKa = 10.22LFAASEE56 pKa = 4.3GRR58 pKa = 11.84DD59 pKa = 3.58VIQVTDD65 pKa = 4.1EE66 pKa = 3.74NDD68 pKa = 2.99QALRR72 pKa = 11.84EE73 pKa = 4.21SGAFNGQGDD82 pKa = 3.84FF83 pKa = 4.13
MM1 pKa = 7.64ANMVIRR7 pKa = 11.84FGDD10 pKa = 3.89SHH12 pKa = 6.08WTTVMIKK19 pKa = 10.28NSPVYY24 pKa = 9.91YY25 pKa = 8.81WQEE28 pKa = 3.42SDD30 pKa = 3.9GYY32 pKa = 8.25YY33 pKa = 10.15VCIDD37 pKa = 3.33GRR39 pKa = 11.84PDD41 pKa = 3.66FFNTSTEE48 pKa = 4.02MYY50 pKa = 10.22LFAASEE56 pKa = 4.3GRR58 pKa = 11.84DD59 pKa = 3.58VIQVTDD65 pKa = 4.1EE66 pKa = 3.74NDD68 pKa = 2.99QALRR72 pKa = 11.84EE73 pKa = 4.21SGAFNGQGDD82 pKa = 3.84FF83 pKa = 4.13
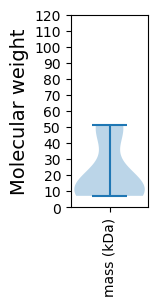
Molecular weight: 9.51 kDa
Isoelectric point according different methods:
Protein with the highest isoelectric point:
>tr|G8IRU9|G8IRU9_9VIRU Minor capsid protein OS=Vibrio phage VCY-phi OX=1105327 PE=4 SV=1
MM1 pKa = 7.81KK2 pKa = 9.97FRR4 pKa = 11.84NMAKK8 pKa = 10.12KK9 pKa = 10.25FGVVVAASVPSYY21 pKa = 11.33GVFAADD27 pKa = 5.46DD28 pKa = 3.43ISAQLTAAITSGQANYY44 pKa = 9.9TMVVVGVIGLAAIAFGLGRR63 pKa = 11.84ILGILKK69 pKa = 10.39
MM1 pKa = 7.81KK2 pKa = 9.97FRR4 pKa = 11.84NMAKK8 pKa = 10.12KK9 pKa = 10.25FGVVVAASVPSYY21 pKa = 11.33GVFAADD27 pKa = 5.46DD28 pKa = 3.43ISAQLTAAITSGQANYY44 pKa = 9.9TMVVVGVIGLAAIAFGLGRR63 pKa = 11.84ILGILKK69 pKa = 10.39
Molecular weight: 7.06 kDa
Isoelectric point according different methods:
Peptides (in silico digests for buttom-up proteomics)
Below you can find in silico digests of the whole proteome with Trypsin, Chymotrypsin, Trypsin+LysC, LysN, ArgC proteases suitable for different mass spec machines.| Try ESI |
 |
|---|
| ChTry ESI |
|
|---|
| ArgC ESI |
|
|---|
| LysN ESI |
|
|---|
| TryLysC ESI |
|
|---|
| Try MALDI |
|
|---|
| ChTry MALDI |
|
|---|
| ArgC MALDI |
|
|---|
| LysN MALDI |
|
|---|
| TryLysC MALDI |
|
|---|
| Try LTQ |
|
|---|
| ChTry LTQ |
|
|---|
| ArgC LTQ |
|
|---|
| LysN LTQ |
|
|---|
| TryLysC LTQ |
|
|---|
| Try MSlow |
|
|---|
| ChTry MSlow |
|
|---|
| ArgC MSlow |
|
|---|
| LysN MSlow |
|
|---|
| TryLysC MSlow |
|
|---|
| Try MShigh |
|
|---|
| ChTry MShigh |
|
|---|
| ArgC MShigh |
|
|---|
| LysN MShigh |
|
|---|
| TryLysC MShigh |
|
|---|
General Statistics
Number of major isoforms |
Number of additional isoforms |
Number of all proteins |
Number of amino acids |
Min. Seq. Length |
Max. Seq. Length |
Avg. Seq. Length |
Avg. Mol. Weight |
|---|---|---|---|---|---|---|---|
0 |
2126 |
61 |
475 |
193.3 |
21.61 |
Amino acid frequency
Ala |
Cys |
Asp |
Glu |
Phe |
Gly |
His |
Ile |
Lys |
Leu |
|---|---|---|---|---|---|---|---|---|---|
6.914 ± 0.699 | 1.552 ± 0.16 |
5.597 ± 0.377 | 5.221 ± 0.387 |
5.833 ± 0.615 | 7.479 ± 0.723 |
1.176 ± 0.265 | 6.491 ± 0.411 |
5.644 ± 0.68 | 9.784 ± 0.712 |
Met |
Asn |
Gln |
Pro |
Arg |
Ser |
Thr |
Val |
Trp |
Tyr |
|---|---|---|---|---|---|---|---|---|---|
2.493 ± 0.422 | 5.833 ± 0.766 |
3.716 ± 0.466 | 4.233 ± 0.211 |
4.139 ± 0.635 | 7.432 ± 0.997 |
5.456 ± 0.619 | 5.833 ± 0.407 |
1.129 ± 0.274 | 4.045 ± 0.708 |
Most of the basic statistics you can see at this page can be downloaded from this CSV file
See this proteome in:

Proteome-pI is available under Creative Commons Attribution-NoDerivs license, for more details see here
| Reference: Kozlowski LP. Proteome-pI 2.0: Proteome Isoelectric Point Database Update. Nucleic Acids Res. 2021, doi: 10.1093/nar/gkab944 | Contact: Lukasz P. Kozlowski |