Paucibacter sp. KBW04
Taxonomy: cellular organisms; Bacteria; Proteobacteria; Betaproteobacteria; Burkholderiales; Burkholderiales genera incertae sedis; Paucibacter; unclassified Paucibacter
Average proteome isoelectric point is 6.91
Get precalculated fractions of proteins
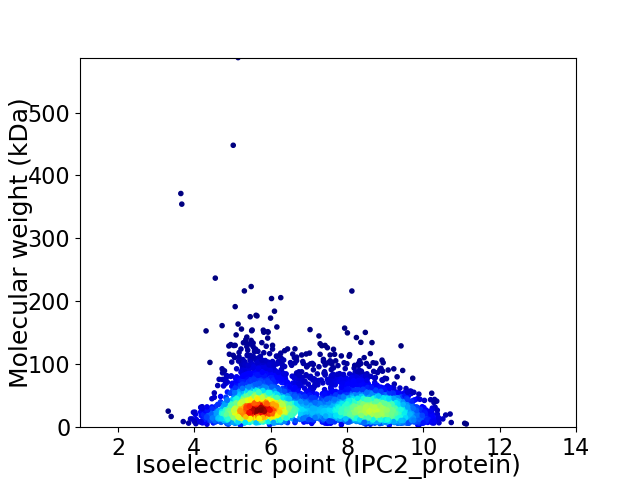
Virtual 2D-PAGE plot for 4784 proteins (isoelectric point calculated using IPC2_protein)
Get csv file with sequences according to given criteria:
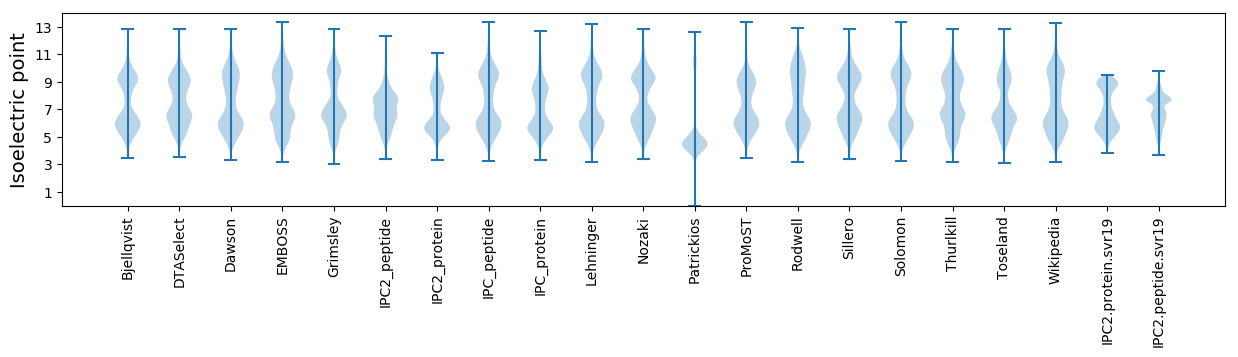
* You can choose from 21 different methods for calculating isoelectric point
Summary statistics related to proteome-wise predictions
Protein with the lowest isoelectric point:
>tr|A0A3N7C7W3|A0A3N7C7W3_9BURK Flagellin OS=Paucibacter sp. KBW04 OX=2153361 GN=DBR47_18035 PE=3 SV=1
MM1 pKa = 7.59CLICGWIYY9 pKa = 11.2DD10 pKa = 4.08EE11 pKa = 4.96AAGDD15 pKa = 4.19PEE17 pKa = 5.37HH18 pKa = 7.1GIAPGTVWADD28 pKa = 2.55VDD30 pKa = 4.37MNWTCPEE37 pKa = 3.86CGARR41 pKa = 11.84KK42 pKa = 9.87DD43 pKa = 3.6DD44 pKa = 3.99FEE46 pKa = 4.37MVRR49 pKa = 11.84II50 pKa = 4.15
MM1 pKa = 7.59CLICGWIYY9 pKa = 11.2DD10 pKa = 4.08EE11 pKa = 4.96AAGDD15 pKa = 4.19PEE17 pKa = 5.37HH18 pKa = 7.1GIAPGTVWADD28 pKa = 2.55VDD30 pKa = 4.37MNWTCPEE37 pKa = 3.86CGARR41 pKa = 11.84KK42 pKa = 9.87DD43 pKa = 3.6DD44 pKa = 3.99FEE46 pKa = 4.37MVRR49 pKa = 11.84II50 pKa = 4.15
Molecular weight: 5.59 kDa
Isoelectric point according different methods:
Protein with the highest isoelectric point:
>tr|A0A3N7BW92|A0A3N7BW92_9BURK BadM/Rrf2 family transcriptional regulator OS=Paucibacter sp. KBW04 OX=2153361 GN=DBR47_16525 PE=4 SV=1
MM1 pKa = 7.72RR2 pKa = 11.84GGRR5 pKa = 11.84HH6 pKa = 6.14RR7 pKa = 11.84GGQXGGGGSWALGGRR22 pKa = 11.84LGLGGVKK29 pKa = 10.28LLSRR33 pKa = 11.84VANWALPGWVPALARR48 pKa = 11.84SVVLGVGGRR57 pKa = 11.84RR58 pKa = 11.84GPVFPP63 pKa = 5.67
MM1 pKa = 7.72RR2 pKa = 11.84GGRR5 pKa = 11.84HH6 pKa = 6.14RR7 pKa = 11.84GGQXGGGGSWALGGRR22 pKa = 11.84LGLGGVKK29 pKa = 10.28LLSRR33 pKa = 11.84VANWALPGWVPALARR48 pKa = 11.84SVVLGVGGRR57 pKa = 11.84RR58 pKa = 11.84GPVFPP63 pKa = 5.67
Molecular weight: 6.24 kDa
Isoelectric point according different methods:
Peptides (in silico digests for buttom-up proteomics)
Below you can find in silico digests of the whole proteome with Trypsin, Chymotrypsin, Trypsin+LysC, LysN, ArgC proteases suitable for different mass spec machines.| Try ESI |
 |
|---|
| ChTry ESI |
|
|---|
| ArgC ESI |
|
|---|
| LysN ESI |
|
|---|
| TryLysC ESI |
|
|---|
| Try MALDI |
|
|---|
| ChTry MALDI |
|
|---|
| ArgC MALDI |
|
|---|
| LysN MALDI |
|
|---|
| TryLysC MALDI |
|
|---|
| Try LTQ |
|
|---|
| ChTry LTQ |
|
|---|
| ArgC LTQ |
|
|---|
| LysN LTQ |
|
|---|
| TryLysC LTQ |
|
|---|
| Try MSlow |
|
|---|
| ChTry MSlow |
|
|---|
| ArgC MSlow |
|
|---|
| LysN MSlow |
|
|---|
| TryLysC MSlow |
|
|---|
| Try MShigh |
|
|---|
| ChTry MShigh |
|
|---|
| ArgC MShigh |
|
|---|
| LysN MShigh |
|
|---|
| TryLysC MShigh |
|
|---|
General Statistics
Number of major isoforms |
Number of additional isoforms |
Number of all proteins |
Number of amino acids |
Min. Seq. Length |
Max. Seq. Length |
Avg. Seq. Length |
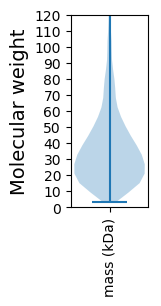
Avg. Mol. Weight |
|---|---|---|---|---|---|---|---|
0 |
1670315 |
29 |
5506 |
349.1 |
37.9 |
Amino acid frequency
Ala |
Cys |
Asp |
Glu |
Phe |
Gly |
His |
Ile |
Lys |
Leu |
|---|---|---|---|---|---|---|---|---|---|
12.906 ± 0.055 | 0.916 ± 0.013 |
4.821 ± 0.027 | 5.483 ± 0.036 |
3.463 ± 0.023 | 8.171 ± 0.036 |
2.062 ± 0.017 | 4.029 ± 0.02 |
3.478 ± 0.035 | 11.944 ± 0.053 |
Met |
Asn |
Gln |
Pro |
Arg |
Ser |
Thr |
Val |
Trp |
Tyr |
|---|---|---|---|---|---|---|---|---|---|
2.328 ± 0.017 | 2.7 ± 0.025 |
5.068 ± 0.028 | 4.893 ± 0.033 |
6.587 ± 0.035 | 6.206 ± 0.043 |
4.482 ± 0.028 | 6.777 ± 0.032 |
1.549 ± 0.016 | 2.136 ± 0.021 |
Most of the basic statistics you can see at this page can be downloaded from this CSV file
See this proteome in:

Proteome-pI is available under Creative Commons Attribution-NoDerivs license, for more details see here
| Reference: Kozlowski LP. Proteome-pI 2.0: Proteome Isoelectric Point Database Update. Nucleic Acids Res. 2021, doi: 10.1093/nar/gkab944 | Contact: Lukasz P. Kozlowski |