Bordetella genomosp. 4
Taxonomy: cellular organisms; Bacteria; Proteobacteria; Betaproteobacteria; Burkholderiales; Alcaligenaceae; Bordetella
Average proteome isoelectric point is 6.63
Get precalculated fractions of proteins
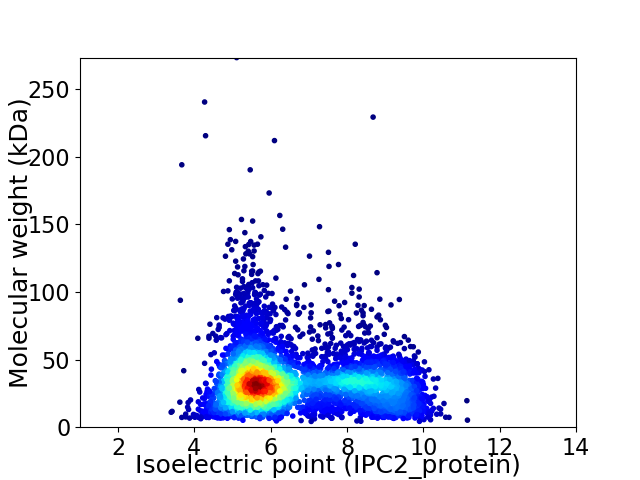
Virtual 2D-PAGE plot for 4978 proteins (isoelectric point calculated using IPC2_protein)
Get csv file with sequences according to given criteria:
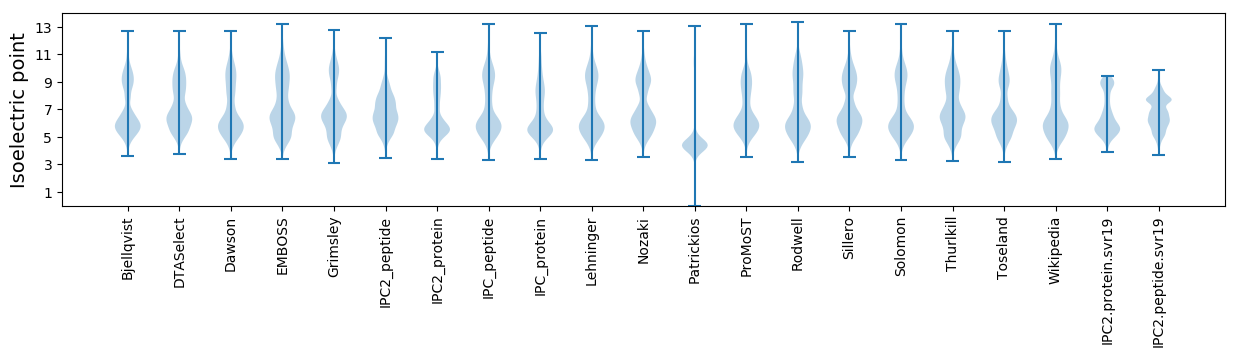
* You can choose from 21 different methods for calculating isoelectric point
Summary statistics related to proteome-wise predictions
Protein with the lowest isoelectric point:
>tr|A0A261UX77|A0A261UX77_9BORD MFS transporter OS=Bordetella genomosp. 4 OX=463044 GN=CAL20_02320 PE=3 SV=1
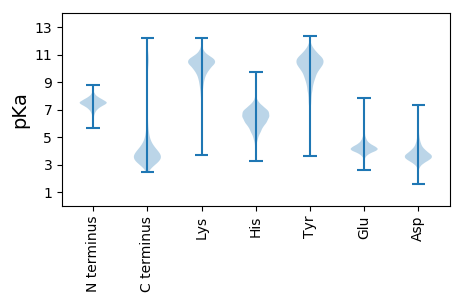
MM1 pKa = 7.12RR2 pKa = 11.84TWMCLICGWVYY13 pKa = 11.1DD14 pKa = 4.38EE15 pKa = 5.24EE16 pKa = 5.79SGLPEE21 pKa = 4.07EE22 pKa = 5.66GIAPGTRR29 pKa = 11.84WEE31 pKa = 4.42DD32 pKa = 3.53VPPNWVCPEE41 pKa = 3.8CGARR45 pKa = 11.84KK46 pKa = 9.54EE47 pKa = 4.36DD48 pKa = 3.84FEE50 pKa = 5.52LMEE53 pKa = 4.22II54 pKa = 4.3
MM1 pKa = 7.12RR2 pKa = 11.84TWMCLICGWVYY13 pKa = 11.1DD14 pKa = 4.38EE15 pKa = 5.24EE16 pKa = 5.79SGLPEE21 pKa = 4.07EE22 pKa = 5.66GIAPGTRR29 pKa = 11.84WEE31 pKa = 4.42DD32 pKa = 3.53VPPNWVCPEE41 pKa = 3.8CGARR45 pKa = 11.84KK46 pKa = 9.54EE47 pKa = 4.36DD48 pKa = 3.84FEE50 pKa = 5.52LMEE53 pKa = 4.22II54 pKa = 4.3
Molecular weight: 6.28 kDa
Isoelectric point according different methods:
Protein with the highest isoelectric point:
>tr|A0A261V1Z6|A0A261V1Z6_9BORD NAD(+) diphosphatase OS=Bordetella genomosp. 4 OX=463044 GN=CAL20_02040 PE=4 SV=1
MM1 pKa = 7.35KK2 pKa = 9.36RR3 pKa = 11.84TYY5 pKa = 10.06QPSVTRR11 pKa = 11.84RR12 pKa = 11.84KK13 pKa = 8.0RR14 pKa = 11.84THH16 pKa = 5.76GFRR19 pKa = 11.84VRR21 pKa = 11.84MKK23 pKa = 9.39TRR25 pKa = 11.84GGRR28 pKa = 11.84AVLNARR34 pKa = 11.84RR35 pKa = 11.84AKK37 pKa = 9.65GRR39 pKa = 11.84KK40 pKa = 8.75RR41 pKa = 11.84LAVV44 pKa = 3.41
MM1 pKa = 7.35KK2 pKa = 9.36RR3 pKa = 11.84TYY5 pKa = 10.06QPSVTRR11 pKa = 11.84RR12 pKa = 11.84KK13 pKa = 8.0RR14 pKa = 11.84THH16 pKa = 5.76GFRR19 pKa = 11.84VRR21 pKa = 11.84MKK23 pKa = 9.39TRR25 pKa = 11.84GGRR28 pKa = 11.84AVLNARR34 pKa = 11.84RR35 pKa = 11.84AKK37 pKa = 9.65GRR39 pKa = 11.84KK40 pKa = 8.75RR41 pKa = 11.84LAVV44 pKa = 3.41
Molecular weight: 5.21 kDa
Isoelectric point according different methods:
Peptides (in silico digests for buttom-up proteomics)
Below you can find in silico digests of the whole proteome with Trypsin, Chymotrypsin, Trypsin+LysC, LysN, ArgC proteases suitable for different mass spec machines.| Try ESI |
 |
|---|
| ChTry ESI |
|
|---|
| ArgC ESI |
|
|---|
| LysN ESI |
|
|---|
| TryLysC ESI |
|
|---|
| Try MALDI |
|
|---|
| ChTry MALDI |
|
|---|
| ArgC MALDI |
|
|---|
| LysN MALDI |
|
|---|
| TryLysC MALDI |
|
|---|
| Try LTQ |
|
|---|
| ChTry LTQ |
|
|---|
| ArgC LTQ |
|
|---|
| LysN LTQ |
|
|---|
| TryLysC LTQ |
|
|---|
| Try MSlow |
|
|---|
| ChTry MSlow |
|
|---|
| ArgC MSlow |
|
|---|
| LysN MSlow |
|
|---|
| TryLysC MSlow |
|
|---|
| Try MShigh |
|
|---|
| ChTry MShigh |
|
|---|
| ArgC MShigh |
|
|---|
| LysN MShigh |
|
|---|
| TryLysC MShigh |
|
|---|
General Statistics
Number of major isoforms |
Number of additional isoforms |
Number of all proteins |
Number of amino acids |
Min. Seq. Length |
Max. Seq. Length |
Avg. Seq. Length |
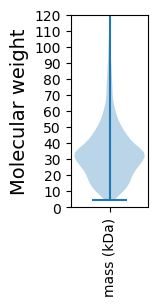
Avg. Mol. Weight |
|---|---|---|---|---|---|---|---|
0 |
1641817 |
37 |
2546 |
329.8 |
35.84 |
Amino acid frequency
Ala |
Cys |
Asp |
Glu |
Phe |
Gly |
His |
Ile |
Lys |
Leu |
|---|---|---|---|---|---|---|---|---|---|
12.23 ± 0.043 | 0.909 ± 0.01 |
5.459 ± 0.026 | 5.05 ± 0.029 |
3.378 ± 0.021 | 8.218 ± 0.041 |
2.256 ± 0.02 | 4.909 ± 0.023 |
3.066 ± 0.03 | 10.57 ± 0.043 |
Met |
Asn |
Gln |
Pro |
Arg |
Ser |
Thr |
Val |
Trp |
Tyr |
|---|---|---|---|---|---|---|---|---|---|
2.518 ± 0.017 | 2.796 ± 0.024 |
5.212 ± 0.025 | 4.105 ± 0.023 |
6.746 ± 0.039 | 5.722 ± 0.027 |
5.372 ± 0.028 | 7.581 ± 0.028 |
1.409 ± 0.016 | 2.496 ± 0.019 |
Most of the basic statistics you can see at this page can be downloaded from this CSV file
See this proteome in:

Proteome-pI is available under Creative Commons Attribution-NoDerivs license, for more details see here
| Reference: Kozlowski LP. Proteome-pI 2.0: Proteome Isoelectric Point Database Update. Nucleic Acids Res. 2021, doi: 10.1093/nar/gkab944 | Contact: Lukasz P. Kozlowski |