Mycobacterium phage Spikelee
Taxonomy: Viruses; Duplodnaviria; Heunggongvirae; Uroviricota; Caudoviricetes; Caudovirales; Siphoviridae; Cheoctovirus; unclassified Cheoctovirus
Average proteome isoelectric point is 6.1
Get precalculated fractions of proteins
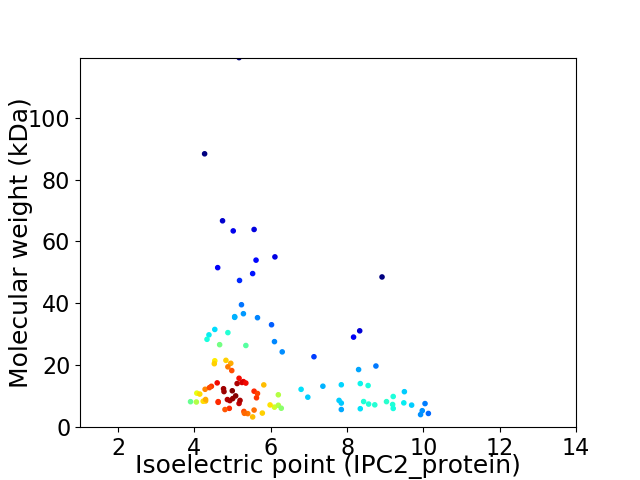
Virtual 2D-PAGE plot for 104 proteins (isoelectric point calculated using IPC2_protein)
Get csv file with sequences according to given criteria:
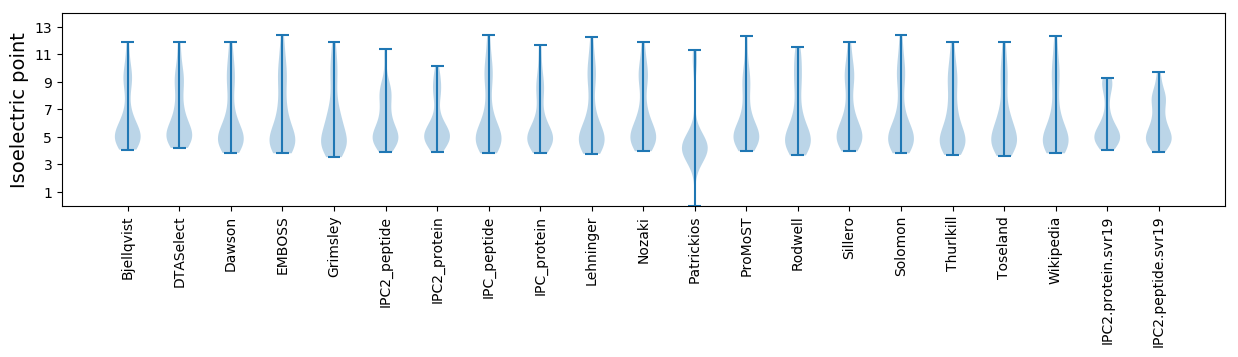
* You can choose from 21 different methods for calculating isoelectric point
Summary statistics related to proteome-wise predictions
Protein with the lowest isoelectric point:
>tr|A0A385DU50|A0A385DU50_9CAUD Uncharacterized protein OS=Mycobacterium phage Spikelee OX=2301571 GN=53 PE=4 SV=1
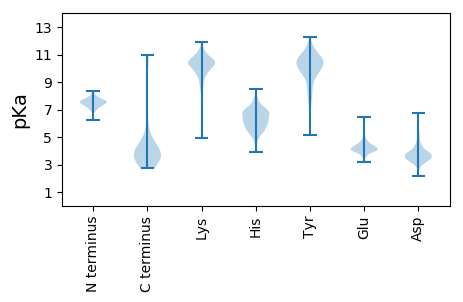
MM1 pKa = 7.54EE2 pKa = 6.3SIDD5 pKa = 4.49TDD7 pKa = 3.71EE8 pKa = 4.56QLNGYY13 pKa = 8.47PPNTVILDD21 pKa = 3.65ADD23 pKa = 3.36EE24 pKa = 4.41WAWQKK29 pKa = 11.11DD30 pKa = 4.24VNQGSHH36 pKa = 5.75LWIPAAFYY44 pKa = 11.28SEE46 pKa = 5.12LLVDD50 pKa = 4.39DD51 pKa = 5.19GGRR54 pKa = 11.84PSLPARR60 pKa = 11.84LLYY63 pKa = 10.51VPHH66 pKa = 7.11ANSANEE72 pKa = 4.01SS73 pKa = 3.51
MM1 pKa = 7.54EE2 pKa = 6.3SIDD5 pKa = 4.49TDD7 pKa = 3.71EE8 pKa = 4.56QLNGYY13 pKa = 8.47PPNTVILDD21 pKa = 3.65ADD23 pKa = 3.36EE24 pKa = 4.41WAWQKK29 pKa = 11.11DD30 pKa = 4.24VNQGSHH36 pKa = 5.75LWIPAAFYY44 pKa = 11.28SEE46 pKa = 5.12LLVDD50 pKa = 4.39DD51 pKa = 5.19GGRR54 pKa = 11.84PSLPARR60 pKa = 11.84LLYY63 pKa = 10.51VPHH66 pKa = 7.11ANSANEE72 pKa = 4.01SS73 pKa = 3.51
Molecular weight: 8.14 kDa
Isoelectric point according different methods:
Protein with the highest isoelectric point:
>tr|A0A385DRS3|A0A385DRS3_9CAUD Tail assembly chaperone OS=Mycobacterium phage Spikelee OX=2301571 GN=14 PE=4 SV=1
MM1 pKa = 7.41SAFPPPRR8 pKa = 11.84TLTEE12 pKa = 5.0RR13 pKa = 11.84IQGAHH18 pKa = 6.7LNLKK22 pKa = 9.84LARR25 pKa = 11.84QSGNPDD31 pKa = 3.26IIAAAEE37 pKa = 4.34RR38 pKa = 11.84ILNQLVDD45 pKa = 3.97RR46 pKa = 11.84LPRR49 pKa = 11.84PTHH52 pKa = 5.73QEE54 pKa = 3.46
MM1 pKa = 7.41SAFPPPRR8 pKa = 11.84TLTEE12 pKa = 5.0RR13 pKa = 11.84IQGAHH18 pKa = 6.7LNLKK22 pKa = 9.84LARR25 pKa = 11.84QSGNPDD31 pKa = 3.26IIAAAEE37 pKa = 4.34RR38 pKa = 11.84ILNQLVDD45 pKa = 3.97RR46 pKa = 11.84LPRR49 pKa = 11.84PTHH52 pKa = 5.73QEE54 pKa = 3.46
Molecular weight: 6.05 kDa
Isoelectric point according different methods:
Peptides (in silico digests for buttom-up proteomics)
Below you can find in silico digests of the whole proteome with Trypsin, Chymotrypsin, Trypsin+LysC, LysN, ArgC proteases suitable for different mass spec machines.| Try ESI |
 |
|---|
| ChTry ESI |
|
|---|
| ArgC ESI |
|
|---|
| LysN ESI |
|
|---|
| TryLysC ESI |
|
|---|
| Try MALDI |
|
|---|
| ChTry MALDI |
|
|---|
| ArgC MALDI |
|
|---|
| LysN MALDI |
|
|---|
| TryLysC MALDI |
|
|---|
| Try LTQ |
|
|---|
| ChTry LTQ |
|
|---|
| ArgC LTQ |
|
|---|
| LysN LTQ |
|
|---|
| TryLysC LTQ |
|
|---|
| Try MSlow |
|
|---|
| ChTry MSlow |
|
|---|
| ArgC MSlow |
|
|---|
| LysN MSlow |
|
|---|
| TryLysC MSlow |
|
|---|
| Try MShigh |
|
|---|
| ChTry MShigh |
|
|---|
| ArgC MShigh |
|
|---|
| LysN MShigh |
|
|---|
| TryLysC MShigh |
|
|---|
General Statistics
Number of major isoforms |
Number of additional isoforms |
Number of all proteins |
Number of amino acids |
Min. Seq. Length |
Max. Seq. Length |
Avg. Seq. Length |
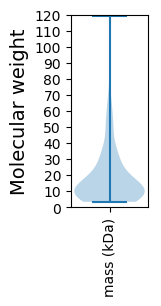
Avg. Mol. Weight |
|---|---|---|---|---|---|---|---|
0 |
18469 |
30 |
1170 |
177.6 |
19.39 |
Amino acid frequency
Ala |
Cys |
Asp |
Glu |
Phe |
Gly |
His |
Ile |
Lys |
Leu |
|---|---|---|---|---|---|---|---|---|---|
10.84 ± 0.509 | 1.072 ± 0.13 |
6.508 ± 0.23 | 5.853 ± 0.268 |
2.918 ± 0.169 | 8.885 ± 0.517 |
2.128 ± 0.177 | 4.548 ± 0.168 |
3.433 ± 0.177 | 7.499 ± 0.19 |
Met |
Asn |
Gln |
Pro |
Arg |
Ser |
Thr |
Val |
Trp |
Tyr |
|---|---|---|---|---|---|---|---|---|---|
2.263 ± 0.096 | 3.476 ± 0.17 |
5.972 ± 0.197 | 3.568 ± 0.188 |
6.676 ± 0.336 | 6.021 ± 0.284 |
6.351 ± 0.265 | 7.158 ± 0.278 |
2.29 ± 0.142 | 2.539 ± 0.151 |
Most of the basic statistics you can see at this page can be downloaded from this CSV file
See this proteome in:

Proteome-pI is available under Creative Commons Attribution-NoDerivs license, for more details see here
| Reference: Kozlowski LP. Proteome-pI 2.0: Proteome Isoelectric Point Database Update. Nucleic Acids Res. 2021, doi: 10.1093/nar/gkab944 | Contact: Lukasz P. Kozlowski |