Serratia sp. S1B
Taxonomy: cellular organisms; Bacteria; Proteobacteria; Gammaproteobacteria; Enterobacterales; Yersiniaceae; Serratia; unclassified Serratia
Average proteome isoelectric point is 6.53
Get precalculated fractions of proteins
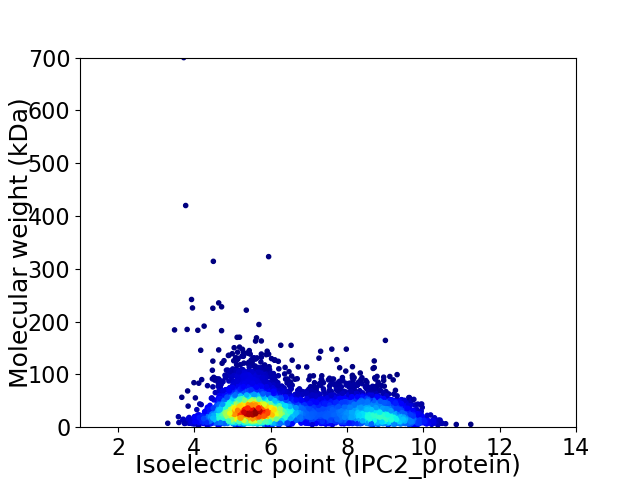
Virtual 2D-PAGE plot for 6810 proteins (isoelectric point calculated using IPC2_protein)
Get csv file with sequences according to given criteria:
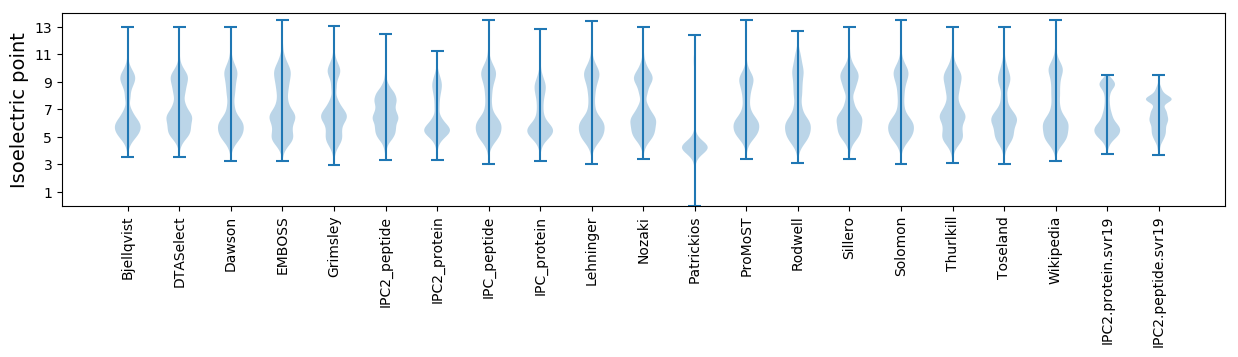
* You can choose from 21 different methods for calculating isoelectric point
Summary statistics related to proteome-wise predictions
Protein with the lowest isoelectric point:
>tr|A0A2V1HS46|A0A2V1HS46_9GAMM WYL domain-containing protein OS=Serratia sp. S1B OX=2233853 GN=C9426_01935 PE=4 SV=1
MM1 pKa = 7.59TCTSCACNDD10 pKa = 3.64LVLEE14 pKa = 4.51LLQILKK20 pKa = 10.44AQIQSQAEE28 pKa = 4.22QNNLLAQIIDD38 pKa = 3.71QNNDD42 pKa = 3.77LIASLCDD49 pKa = 3.34DD50 pKa = 3.88TDD52 pKa = 3.95DD53 pKa = 4.34KK54 pKa = 11.53RR55 pKa = 11.84EE56 pKa = 3.91RR57 pKa = 11.84YY58 pKa = 9.94LDD60 pKa = 4.06DD61 pKa = 3.6EE62 pKa = 4.55
MM1 pKa = 7.59TCTSCACNDD10 pKa = 3.64LVLEE14 pKa = 4.51LLQILKK20 pKa = 10.44AQIQSQAEE28 pKa = 4.22QNNLLAQIIDD38 pKa = 3.71QNNDD42 pKa = 3.77LIASLCDD49 pKa = 3.34DD50 pKa = 3.88TDD52 pKa = 3.95DD53 pKa = 4.34KK54 pKa = 11.53RR55 pKa = 11.84EE56 pKa = 3.91RR57 pKa = 11.84YY58 pKa = 9.94LDD60 pKa = 4.06DD61 pKa = 3.6EE62 pKa = 4.55
Molecular weight: 7.03 kDa
Isoelectric point according different methods:
Protein with the highest isoelectric point:
>tr|A0A2V1HD07|A0A2V1HD07_9GAMM Penicillin-insensitive transglycosylase OS=Serratia sp. S1B OX=2233853 GN=pbpC PE=3 SV=1
MM1 pKa = 7.45KK2 pKa = 9.51RR3 pKa = 11.84TFQPSVLKK11 pKa = 10.6RR12 pKa = 11.84NRR14 pKa = 11.84SHH16 pKa = 7.16GFRR19 pKa = 11.84ARR21 pKa = 11.84MATKK25 pKa = 10.4NGRR28 pKa = 11.84QVLARR33 pKa = 11.84RR34 pKa = 11.84RR35 pKa = 11.84AKK37 pKa = 10.36GRR39 pKa = 11.84TRR41 pKa = 11.84LTVSKK46 pKa = 10.95
MM1 pKa = 7.45KK2 pKa = 9.51RR3 pKa = 11.84TFQPSVLKK11 pKa = 10.6RR12 pKa = 11.84NRR14 pKa = 11.84SHH16 pKa = 7.16GFRR19 pKa = 11.84ARR21 pKa = 11.84MATKK25 pKa = 10.4NGRR28 pKa = 11.84QVLARR33 pKa = 11.84RR34 pKa = 11.84RR35 pKa = 11.84AKK37 pKa = 10.36GRR39 pKa = 11.84TRR41 pKa = 11.84LTVSKK46 pKa = 10.95
Molecular weight: 5.41 kDa
Isoelectric point according different methods:
Peptides (in silico digests for buttom-up proteomics)
Below you can find in silico digests of the whole proteome with Trypsin, Chymotrypsin, Trypsin+LysC, LysN, ArgC proteases suitable for different mass spec machines.| Try ESI |
 |
|---|
| ChTry ESI |
|
|---|
| ArgC ESI |
|
|---|
| LysN ESI |
|
|---|
| TryLysC ESI |
|
|---|
| Try MALDI |
|
|---|
| ChTry MALDI |
|
|---|
| ArgC MALDI |
|
|---|
| LysN MALDI |
|
|---|
| TryLysC MALDI |
|
|---|
| Try LTQ |
|
|---|
| ChTry LTQ |
|
|---|
| ArgC LTQ |
|
|---|
| LysN LTQ |
|
|---|
| TryLysC LTQ |
|
|---|
| Try MSlow |
|
|---|
| ChTry MSlow |
|
|---|
| ArgC MSlow |
|
|---|
| LysN MSlow |
|
|---|
| TryLysC MSlow |
|
|---|
| Try MShigh |
|
|---|
| ChTry MShigh |
|
|---|
| ArgC MShigh |
|
|---|
| LysN MShigh |
|
|---|
| TryLysC MShigh |
|
|---|
General Statistics
Number of major isoforms |
Number of additional isoforms |
Number of all proteins |
Number of amino acids |
Min. Seq. Length |
Max. Seq. Length |
Avg. Seq. Length |
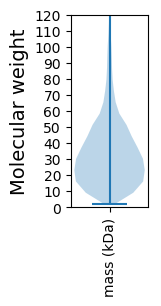
Avg. Mol. Weight |
|---|---|---|---|---|---|---|---|
0 |
2172407 |
15 |
6903 |
319.0 |
35.38 |
Amino acid frequency
Ala |
Cys |
Asp |
Glu |
Phe |
Gly |
His |
Ile |
Lys |
Leu |
|---|---|---|---|---|---|---|---|---|---|
9.224 ± 0.033 | 1.067 ± 0.011 |
4.989 ± 0.024 | 5.486 ± 0.037 |
3.955 ± 0.022 | 7.058 ± 0.036 |
2.419 ± 0.019 | 6.244 ± 0.026 |
4.573 ± 0.03 | 10.93 ± 0.044 |
Met |
Asn |
Gln |
Pro |
Arg |
Ser |
Thr |
Val |
Trp |
Tyr |
|---|---|---|---|---|---|---|---|---|---|
2.582 ± 0.017 | 4.099 ± 0.039 |
4.252 ± 0.019 | 5.451 ± 0.032 |
4.942 ± 0.031 | 6.068 ± 0.03 |
5.37 ± 0.04 | 6.909 ± 0.024 |
1.355 ± 0.013 | 3.028 ± 0.017 |
Most of the basic statistics you can see at this page can be downloaded from this CSV file
See this proteome in:

Proteome-pI is available under Creative Commons Attribution-NoDerivs license, for more details see here
| Reference: Kozlowski LP. Proteome-pI 2.0: Proteome Isoelectric Point Database Update. Nucleic Acids Res. 2021, doi: 10.1093/nar/gkab944 | Contact: Lukasz P. Kozlowski |