Leptospira licerasiae serovar Varillal str. VAR 010
Taxonomy: cellular organisms; Bacteria; Spirochaetes; Spirochaetia; Leptospirales; Leptospiraceae; Leptospira; Leptospira licerasiae; Leptospira licerasiae serovar Varillal
Average proteome isoelectric point is 6.87
Get precalculated fractions of proteins
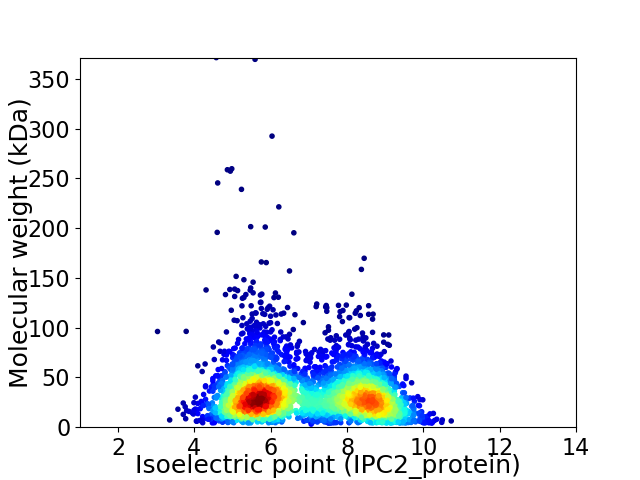
Virtual 2D-PAGE plot for 3927 proteins (isoelectric point calculated using IPC2_protein)
Get csv file with sequences according to given criteria:
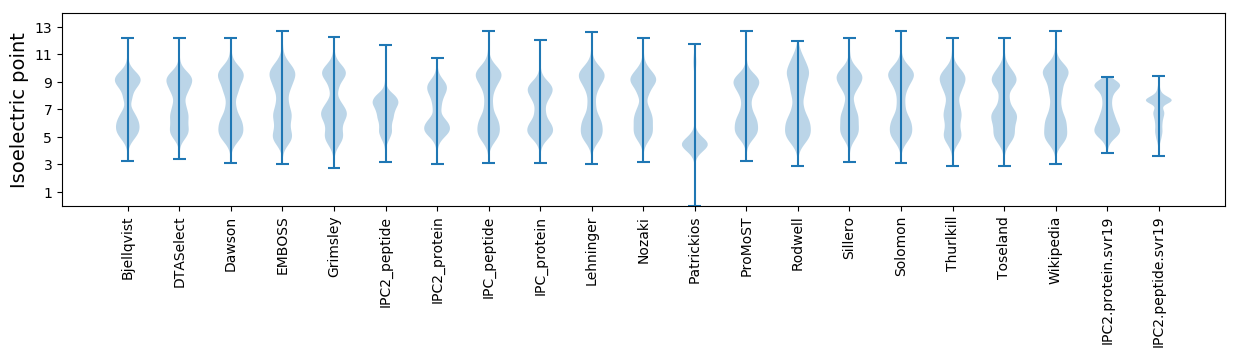
* You can choose from 21 different methods for calculating isoelectric point
Summary statistics related to proteome-wise predictions
Protein with the lowest isoelectric point:
>tr|I0XPK7|I0XPK7_9LEPT Uncharacterized protein OS=Leptospira licerasiae serovar Varillal str. VAR 010 OX=1049972 GN=LEP1GSC185_0180 PE=3 SV=1
MM1 pKa = 7.6LIIHH5 pKa = 6.22NVSCGLVLTGTDD17 pKa = 3.01VGKK20 pKa = 10.71EE21 pKa = 3.73FLGLSEE27 pKa = 4.75EE28 pKa = 4.31DD29 pKa = 3.49KK30 pKa = 11.13KK31 pKa = 11.35DD32 pKa = 3.6PEE34 pKa = 4.01KK35 pKa = 10.55QAAVILSVLGVVSSPYY51 pKa = 10.42LLQFNPPVLTLAEE64 pKa = 4.82SISGSYY70 pKa = 8.4TVSIKK75 pKa = 10.95APIPSEE81 pKa = 3.43WSGNGEE87 pKa = 4.16SVLQAGLNYY96 pKa = 9.81INCPPQSDD104 pKa = 4.76DD105 pKa = 3.63NPSSVVFSGSSNYY118 pKa = 9.85SAQQSFARR126 pKa = 11.84FLEE129 pKa = 4.53PGSCVIEE136 pKa = 4.67FFAASYY142 pKa = 10.8SSDD145 pKa = 2.99MDD147 pKa = 3.7FAEE150 pKa = 5.1GEE152 pKa = 4.51TIGILPVIVNPNAVITASVPDD173 pKa = 3.7
MM1 pKa = 7.6LIIHH5 pKa = 6.22NVSCGLVLTGTDD17 pKa = 3.01VGKK20 pKa = 10.71EE21 pKa = 3.73FLGLSEE27 pKa = 4.75EE28 pKa = 4.31DD29 pKa = 3.49KK30 pKa = 11.13KK31 pKa = 11.35DD32 pKa = 3.6PEE34 pKa = 4.01KK35 pKa = 10.55QAAVILSVLGVVSSPYY51 pKa = 10.42LLQFNPPVLTLAEE64 pKa = 4.82SISGSYY70 pKa = 8.4TVSIKK75 pKa = 10.95APIPSEE81 pKa = 3.43WSGNGEE87 pKa = 4.16SVLQAGLNYY96 pKa = 9.81INCPPQSDD104 pKa = 4.76DD105 pKa = 3.63NPSSVVFSGSSNYY118 pKa = 9.85SAQQSFARR126 pKa = 11.84FLEE129 pKa = 4.53PGSCVIEE136 pKa = 4.67FFAASYY142 pKa = 10.8SSDD145 pKa = 2.99MDD147 pKa = 3.7FAEE150 pKa = 5.1GEE152 pKa = 4.51TIGILPVIVNPNAVITASVPDD173 pKa = 3.7
Molecular weight: 18.22 kDa
Isoelectric point according different methods:
Protein with the highest isoelectric point:
>tr|I0XL16|I0XL16_9LEPT 7TM diverse intracellular signaling domain / adenylate/guanylate cyclase catalytic domain multi-domain protein OS=Leptospira licerasiae serovar Varillal str. VAR 010 OX=1049972 GN=LEP1GSC185_0739 PE=4 SV=1
MM1 pKa = 7.68DD2 pKa = 5.57RR3 pKa = 11.84YY4 pKa = 9.73ATTHH8 pKa = 5.91SGFATFCIVTALAWQARR25 pKa = 11.84SNAKK29 pKa = 9.65RR30 pKa = 11.84RR31 pKa = 11.84NTLVVRR37 pKa = 11.84RR38 pKa = 11.84TSDD41 pKa = 3.03KK42 pKa = 10.66FFLFYY47 pKa = 10.78FRR49 pKa = 11.84VKK51 pKa = 10.66YY52 pKa = 10.15SLEE55 pKa = 3.66RR56 pKa = 11.84AVQNFPYY63 pKa = 10.27VSPLLRR69 pKa = 11.84CSGAEE74 pKa = 3.72LWNSILLIKK83 pKa = 10.51LQFGDD88 pKa = 4.56SNWSRR93 pKa = 11.84IRR95 pKa = 11.84SGDD98 pKa = 3.51LASEE102 pKa = 4.17SSILPKK108 pKa = 10.43RR109 pKa = 11.84QFTEE113 pKa = 4.01VQKK116 pKa = 11.15YY117 pKa = 9.95KK118 pKa = 10.92YY119 pKa = 10.12FEE121 pKa = 4.29CTVFGSDD128 pKa = 3.2VGLTFGASAALRR140 pKa = 11.84ARR142 pKa = 11.84FATLAWPSAHH152 pKa = 6.43FALSLALQSKK162 pKa = 9.92SRR164 pKa = 11.84AKK166 pKa = 10.75SFGLAKK172 pKa = 10.19RR173 pKa = 11.84RR174 pKa = 11.84NTLVVRR180 pKa = 11.84RR181 pKa = 11.84KK182 pKa = 9.91ALNTFDD188 pKa = 5.17VRR190 pKa = 11.84DD191 pKa = 3.61LL192 pKa = 3.91
MM1 pKa = 7.68DD2 pKa = 5.57RR3 pKa = 11.84YY4 pKa = 9.73ATTHH8 pKa = 5.91SGFATFCIVTALAWQARR25 pKa = 11.84SNAKK29 pKa = 9.65RR30 pKa = 11.84RR31 pKa = 11.84NTLVVRR37 pKa = 11.84RR38 pKa = 11.84TSDD41 pKa = 3.03KK42 pKa = 10.66FFLFYY47 pKa = 10.78FRR49 pKa = 11.84VKK51 pKa = 10.66YY52 pKa = 10.15SLEE55 pKa = 3.66RR56 pKa = 11.84AVQNFPYY63 pKa = 10.27VSPLLRR69 pKa = 11.84CSGAEE74 pKa = 3.72LWNSILLIKK83 pKa = 10.51LQFGDD88 pKa = 4.56SNWSRR93 pKa = 11.84IRR95 pKa = 11.84SGDD98 pKa = 3.51LASEE102 pKa = 4.17SSILPKK108 pKa = 10.43RR109 pKa = 11.84QFTEE113 pKa = 4.01VQKK116 pKa = 11.15YY117 pKa = 9.95KK118 pKa = 10.92YY119 pKa = 10.12FEE121 pKa = 4.29CTVFGSDD128 pKa = 3.2VGLTFGASAALRR140 pKa = 11.84ARR142 pKa = 11.84FATLAWPSAHH152 pKa = 6.43FALSLALQSKK162 pKa = 9.92SRR164 pKa = 11.84AKK166 pKa = 10.75SFGLAKK172 pKa = 10.19RR173 pKa = 11.84RR174 pKa = 11.84NTLVVRR180 pKa = 11.84RR181 pKa = 11.84KK182 pKa = 9.91ALNTFDD188 pKa = 5.17VRR190 pKa = 11.84DD191 pKa = 3.61LL192 pKa = 3.91
Molecular weight: 21.9 kDa
Isoelectric point according different methods:
Peptides (in silico digests for buttom-up proteomics)
Below you can find in silico digests of the whole proteome with Trypsin, Chymotrypsin, Trypsin+LysC, LysN, ArgC proteases suitable for different mass spec machines.| Try ESI |
 |
|---|
| ChTry ESI |
|
|---|
| ArgC ESI |
|
|---|
| LysN ESI |
|
|---|
| TryLysC ESI |
|
|---|
| Try MALDI |
|
|---|
| ChTry MALDI |
|
|---|
| ArgC MALDI |
|
|---|
| LysN MALDI |
|
|---|
| TryLysC MALDI |
|
|---|
| Try LTQ |
|
|---|
| ChTry LTQ |
|
|---|
| ArgC LTQ |
|
|---|
| LysN LTQ |
|
|---|
| TryLysC LTQ |
|
|---|
| Try MSlow |
|
|---|
| ChTry MSlow |
|
|---|
| ArgC MSlow |
|
|---|
| LysN MSlow |
|
|---|
| TryLysC MSlow |
|
|---|
| Try MShigh |
|
|---|
| ChTry MShigh |
|
|---|
| ArgC MShigh |
|
|---|
| LysN MShigh |
|
|---|
| TryLysC MShigh |
|
|---|
General Statistics
Number of major isoforms |
Number of additional isoforms |
Number of all proteins |
Number of amino acids |
Min. Seq. Length |
Max. Seq. Length |
Avg. Seq. Length |
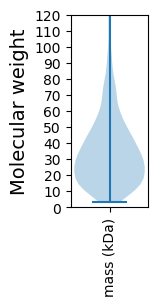
Avg. Mol. Weight |
|---|---|---|---|---|---|---|---|
0 |
1283000 |
27 |
3406 |
326.7 |
36.76 |
Amino acid frequency
Ala |
Cys |
Asp |
Glu |
Phe |
Gly |
His |
Ile |
Lys |
Leu |
|---|---|---|---|---|---|---|---|---|---|
6.233 ± 0.034 | 0.759 ± 0.012 |
4.982 ± 0.026 | 7.236 ± 0.044 |
5.51 ± 0.036 | 7.08 ± 0.04 |
1.634 ± 0.017 | 7.177 ± 0.037 |
7.49 ± 0.032 | 10.497 ± 0.051 |
Met |
Asn |
Gln |
Pro |
Arg |
Ser |
Thr |
Val |
Trp |
Tyr |
|---|---|---|---|---|---|---|---|---|---|
1.896 ± 0.015 | 4.253 ± 0.03 |
4.184 ± 0.027 | 2.984 ± 0.02 |
4.679 ± 0.03 | 7.863 ± 0.041 |
4.861 ± 0.031 | 5.97 ± 0.033 |
1.183 ± 0.015 | 3.526 ± 0.03 |
Most of the basic statistics you can see at this page can be downloaded from this CSV file
See this proteome in:

Proteome-pI is available under Creative Commons Attribution-NoDerivs license, for more details see here
| Reference: Kozlowski LP. Proteome-pI 2.0: Proteome Isoelectric Point Database Update. Nucleic Acids Res. 2021, doi: 10.1093/nar/gkab944 | Contact: Lukasz P. Kozlowski |