Pseudomonas sp. VI4.1
Taxonomy: cellular organisms; Bacteria; Proteobacteria; Gammaproteobacteria; Pseudomonadales; Pseudomonadaceae; Pseudomonas; unclassified Pseudomonas
Average proteome isoelectric point is 6.36
Get precalculated fractions of proteins
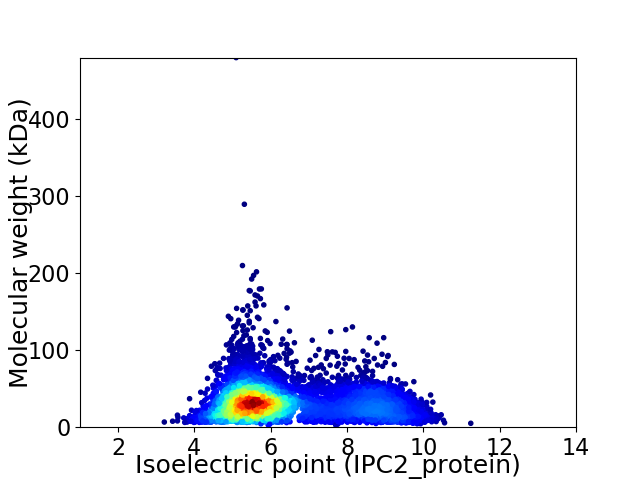
Virtual 2D-PAGE plot for 5946 proteins (isoelectric point calculated using IPC2_protein)
Get csv file with sequences according to given criteria:
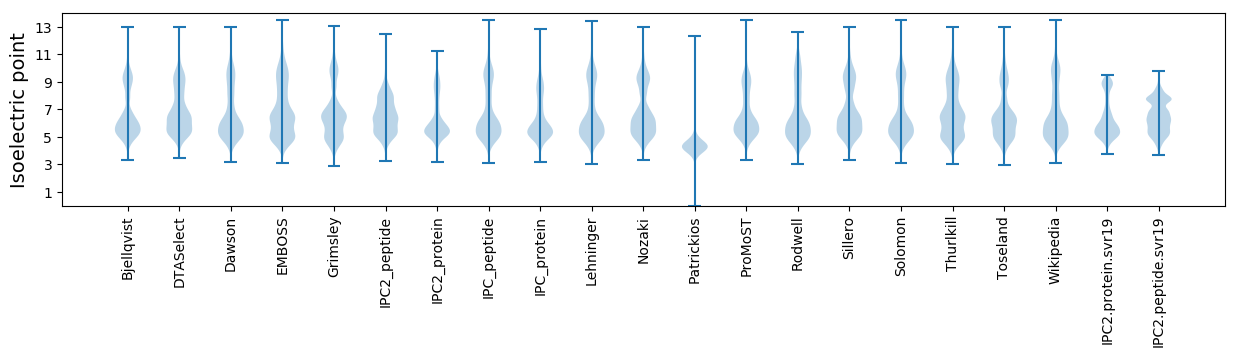
* You can choose from 21 different methods for calculating isoelectric point
Summary statistics related to proteome-wise predictions
Protein with the lowest isoelectric point:
>tr|A0A1V4LXU2|A0A1V4LXU2_9PSED Exodeoxyribonuclease 7 large subunit OS=Pseudomonas sp. VI4.1 OX=1941346 GN=xseA PE=3 SV=1
MM1 pKa = 7.3PALYY5 pKa = 11.13VMIPAALLIVAIAIYY20 pKa = 10.3IFFWAVDD27 pKa = 3.27SGQYY31 pKa = 10.95DD32 pKa = 4.11DD33 pKa = 5.98LDD35 pKa = 4.98GPAHH39 pKa = 6.91SILFDD44 pKa = 4.13DD45 pKa = 5.22QDD47 pKa = 4.33PNHH50 pKa = 5.88QAAVDD55 pKa = 3.82EE56 pKa = 4.94ASGHH60 pKa = 5.35PAKK63 pKa = 10.35PDD65 pKa = 3.5DD66 pKa = 4.05QAPPHH71 pKa = 6.13AA72 pKa = 5.49
MM1 pKa = 7.3PALYY5 pKa = 11.13VMIPAALLIVAIAIYY20 pKa = 10.3IFFWAVDD27 pKa = 3.27SGQYY31 pKa = 10.95DD32 pKa = 4.11DD33 pKa = 5.98LDD35 pKa = 4.98GPAHH39 pKa = 6.91SILFDD44 pKa = 4.13DD45 pKa = 5.22QDD47 pKa = 4.33PNHH50 pKa = 5.88QAAVDD55 pKa = 3.82EE56 pKa = 4.94ASGHH60 pKa = 5.35PAKK63 pKa = 10.35PDD65 pKa = 3.5DD66 pKa = 4.05QAPPHH71 pKa = 6.13AA72 pKa = 5.49
Molecular weight: 7.76 kDa
Isoelectric point according different methods:
Protein with the highest isoelectric point:
>tr|A0A1V4LH29|A0A1V4LH29_9PSED Thiamine-phosphate synthase OS=Pseudomonas sp. VI4.1 OX=1941346 GN=thiE PE=3 SV=1
MM1 pKa = 7.45KK2 pKa = 9.56RR3 pKa = 11.84TFQPSTIKK11 pKa = 10.52RR12 pKa = 11.84ARR14 pKa = 11.84THH16 pKa = 5.94GFRR19 pKa = 11.84ARR21 pKa = 11.84MATKK25 pKa = 10.16NGRR28 pKa = 11.84AVLSRR33 pKa = 11.84RR34 pKa = 11.84RR35 pKa = 11.84AKK37 pKa = 10.38GRR39 pKa = 11.84ARR41 pKa = 11.84LAVV44 pKa = 3.42
MM1 pKa = 7.45KK2 pKa = 9.56RR3 pKa = 11.84TFQPSTIKK11 pKa = 10.52RR12 pKa = 11.84ARR14 pKa = 11.84THH16 pKa = 5.94GFRR19 pKa = 11.84ARR21 pKa = 11.84MATKK25 pKa = 10.16NGRR28 pKa = 11.84AVLSRR33 pKa = 11.84RR34 pKa = 11.84RR35 pKa = 11.84AKK37 pKa = 10.38GRR39 pKa = 11.84ARR41 pKa = 11.84LAVV44 pKa = 3.42
Molecular weight: 5.07 kDa
Isoelectric point according different methods:
Peptides (in silico digests for buttom-up proteomics)
Below you can find in silico digests of the whole proteome with Trypsin, Chymotrypsin, Trypsin+LysC, LysN, ArgC proteases suitable for different mass spec machines.| Try ESI |
 |
|---|
| ChTry ESI |
|
|---|
| ArgC ESI |
|
|---|
| LysN ESI |
|
|---|
| TryLysC ESI |
|
|---|
| Try MALDI |
|
|---|
| ChTry MALDI |
|
|---|
| ArgC MALDI |
|
|---|
| LysN MALDI |
|
|---|
| TryLysC MALDI |
|
|---|
| Try LTQ |
|
|---|
| ChTry LTQ |
|
|---|
| ArgC LTQ |
|
|---|
| LysN LTQ |
|
|---|
| TryLysC LTQ |
|
|---|
| Try MSlow |
|
|---|
| ChTry MSlow |
|
|---|
| ArgC MSlow |
|
|---|
| LysN MSlow |
|
|---|
| TryLysC MSlow |
|
|---|
| Try MShigh |
|
|---|
| ChTry MShigh |
|
|---|
| ArgC MShigh |
|
|---|
| LysN MShigh |
|
|---|
| TryLysC MShigh |
|
|---|
General Statistics
Number of major isoforms |
Number of additional isoforms |
Number of all proteins |
Number of amino acids |
Min. Seq. Length |
Max. Seq. Length |
Avg. Seq. Length |
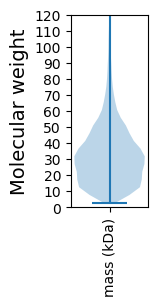
Avg. Mol. Weight |
|---|---|---|---|---|---|---|---|
0 |
1844757 |
23 |
4327 |
310.3 |
34.05 |
Amino acid frequency
Ala |
Cys |
Asp |
Glu |
Phe |
Gly |
His |
Ile |
Lys |
Leu |
|---|---|---|---|---|---|---|---|---|---|
10.731 ± 0.033 | 1.038 ± 0.01 |
5.384 ± 0.026 | 5.603 ± 0.028 |
3.808 ± 0.019 | 7.92 ± 0.032 |
2.297 ± 0.016 | 5.059 ± 0.026 |
3.675 ± 0.026 | 11.427 ± 0.041 |
Met |
Asn |
Gln |
Pro |
Arg |
Ser |
Thr |
Val |
Trp |
Tyr |
|---|---|---|---|---|---|---|---|---|---|
2.476 ± 0.015 | 3.102 ± 0.017 |
4.84 ± 0.021 | 4.337 ± 0.026 |
6.167 ± 0.028 | 5.885 ± 0.024 |
5.045 ± 0.02 | 7.172 ± 0.028 |
1.442 ± 0.015 | 2.595 ± 0.016 |
Most of the basic statistics you can see at this page can be downloaded from this CSV file
See this proteome in:

Proteome-pI is available under Creative Commons Attribution-NoDerivs license, for more details see here
| Reference: Kozlowski LP. Proteome-pI 2.0: Proteome Isoelectric Point Database Update. Nucleic Acids Res. 2021, doi: 10.1093/nar/gkab944 | Contact: Lukasz P. Kozlowski |