Bacillus phage AP631
Taxonomy: Viruses; Duplodnaviria; Heunggongvirae; Uroviricota; Caudoviricetes; Caudovirales; Siphoviridae; Wbetavirus; unclassified Wbetavirus
Average proteome isoelectric point is 6.68
Get precalculated fractions of proteins
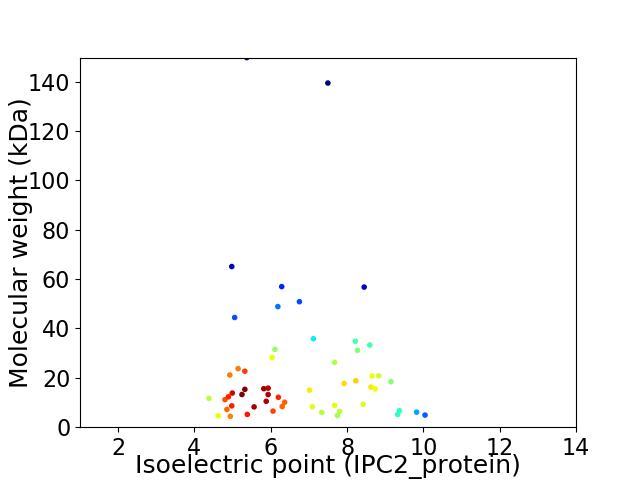
Virtual 2D-PAGE plot for 56 proteins (isoelectric point calculated using IPC2_protein)
Get csv file with sequences according to given criteria:
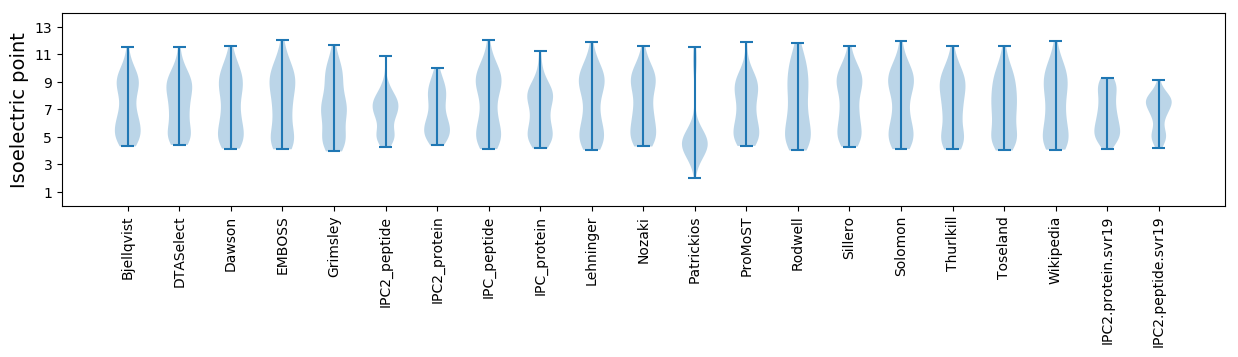
* You can choose from 21 different methods for calculating isoelectric point
Summary statistics related to proteome-wise predictions
Protein with the lowest isoelectric point:
>tr|A0A3G8F2I9|A0A3G8F2I9_9CAUD Uncharacterized protein OS=Bacillus phage AP631 OX=2483609 GN=AP631_0034 PE=4 SV=1
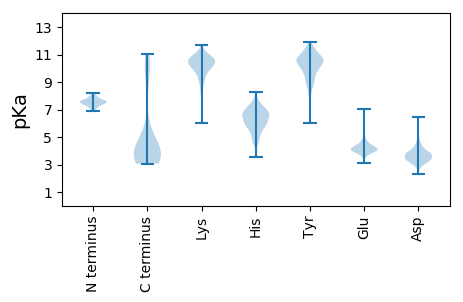
MM1 pKa = 7.7EE2 pKa = 5.41KK3 pKa = 10.6FNDD6 pKa = 3.71YY7 pKa = 10.85FGLEE11 pKa = 4.25SKK13 pKa = 10.98SDD15 pKa = 3.8FVWFYY20 pKa = 11.71GFYY23 pKa = 9.19TVSAILIVINMIIVLII39 pKa = 4.21
MM1 pKa = 7.7EE2 pKa = 5.41KK3 pKa = 10.6FNDD6 pKa = 3.71YY7 pKa = 10.85FGLEE11 pKa = 4.25SKK13 pKa = 10.98SDD15 pKa = 3.8FVWFYY20 pKa = 11.71GFYY23 pKa = 9.19TVSAILIVINMIIVLII39 pKa = 4.21
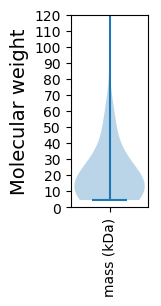
Molecular weight: 4.63 kDa
Isoelectric point according different methods:
Protein with the highest isoelectric point:
>tr|A0A3G8F2J0|A0A3G8F2J0_9CAUD Putative antirepressor OS=Bacillus phage AP631 OX=2483609 GN=AP631_0035 PE=4 SV=1
MM1 pKa = 7.59KK2 pKa = 10.3NGKK5 pKa = 9.15RR6 pKa = 11.84LTKK9 pKa = 10.0RR10 pKa = 11.84EE11 pKa = 4.03KK12 pKa = 10.08IHH14 pKa = 6.42LKK16 pKa = 10.36SYY18 pKa = 11.0SLNPDD23 pKa = 2.3NWLVFKK29 pKa = 10.87KK30 pKa = 10.69ADD32 pKa = 3.59GEE34 pKa = 4.2MHH36 pKa = 6.84LVHH39 pKa = 7.45RR40 pKa = 11.84YY41 pKa = 6.0TSRR44 pKa = 11.84TRR46 pKa = 11.84VIPSLL51 pKa = 3.67
MM1 pKa = 7.59KK2 pKa = 10.3NGKK5 pKa = 9.15RR6 pKa = 11.84LTKK9 pKa = 10.0RR10 pKa = 11.84EE11 pKa = 4.03KK12 pKa = 10.08IHH14 pKa = 6.42LKK16 pKa = 10.36SYY18 pKa = 11.0SLNPDD23 pKa = 2.3NWLVFKK29 pKa = 10.87KK30 pKa = 10.69ADD32 pKa = 3.59GEE34 pKa = 4.2MHH36 pKa = 6.84LVHH39 pKa = 7.45RR40 pKa = 11.84YY41 pKa = 6.0TSRR44 pKa = 11.84TRR46 pKa = 11.84VIPSLL51 pKa = 3.67
Molecular weight: 6.09 kDa
Isoelectric point according different methods:
Peptides (in silico digests for buttom-up proteomics)
Below you can find in silico digests of the whole proteome with Trypsin, Chymotrypsin, Trypsin+LysC, LysN, ArgC proteases suitable for different mass spec machines.| Try ESI |
 |
|---|
| ChTry ESI |
|
|---|
| ArgC ESI |
|
|---|
| LysN ESI |
|
|---|
| TryLysC ESI |
|
|---|
| Try MALDI |
|
|---|
| ChTry MALDI |
|
|---|
| ArgC MALDI |
|
|---|
| LysN MALDI |
|
|---|
| TryLysC MALDI |
|
|---|
| Try LTQ |
|
|---|
| ChTry LTQ |
|
|---|
| ArgC LTQ |
|
|---|
| LysN LTQ |
|
|---|
| TryLysC LTQ |
|
|---|
| Try MSlow |
|
|---|
| ChTry MSlow |
|
|---|
| ArgC MSlow |
|
|---|
| LysN MSlow |
|
|---|
| TryLysC MSlow |
|
|---|
| Try MShigh |
|
|---|
| ChTry MShigh |
|
|---|
| ArgC MShigh |
|
|---|
| LysN MShigh |
|
|---|
| TryLysC MShigh |
|
|---|
General Statistics
Number of major isoforms |
Number of additional isoforms |
Number of all proteins |
Number of amino acids |
Min. Seq. Length |
Max. Seq. Length |
Avg. Seq. Length |
Avg. Mol. Weight |
|---|---|---|---|---|---|---|---|
0 |
11535 |
37 |
1332 |
206.0 |
23.54 |
Amino acid frequency
Ala |
Cys |
Asp |
Glu |
Phe |
Gly |
His |
Ile |
Lys |
Leu |
|---|---|---|---|---|---|---|---|---|---|
6.181 ± 0.619 | 1.049 ± 0.262 |
5.635 ± 0.254 | 8.834 ± 0.28 |
3.927 ± 0.252 | 5.817 ± 0.323 |
1.552 ± 0.203 | 6.953 ± 0.318 |
9.788 ± 0.402 | 8.314 ± 0.36 |
Met |
Asn |
Gln |
Pro |
Arg |
Ser |
Thr |
Val |
Trp |
Tyr |
|---|---|---|---|---|---|---|---|---|---|
2.713 ± 0.159 | 5.323 ± 0.213 |
2.557 ± 0.209 | 4.066 ± 0.322 |
4.846 ± 0.264 | 6.025 ± 0.253 |
5.54 ± 0.357 | 6.181 ± 0.206 |
1.136 ± 0.147 | 3.563 ± 0.272 |
Most of the basic statistics you can see at this page can be downloaded from this CSV file
See this proteome in:

Proteome-pI is available under Creative Commons Attribution-NoDerivs license, for more details see here
| Reference: Kozlowski LP. Proteome-pI 2.0: Proteome Isoelectric Point Database Update. Nucleic Acids Res. 2021, doi: 10.1093/nar/gkab944 | Contact: Lukasz P. Kozlowski |