Bacillus phage pW2
Taxonomy: Viruses; Duplodnaviria; Heunggongvirae; Uroviricota; Caudoviricetes; Caudovirales; Siphoviridae; unclassified Siphoviridae
Average proteome isoelectric point is 6.31
Get precalculated fractions of proteins
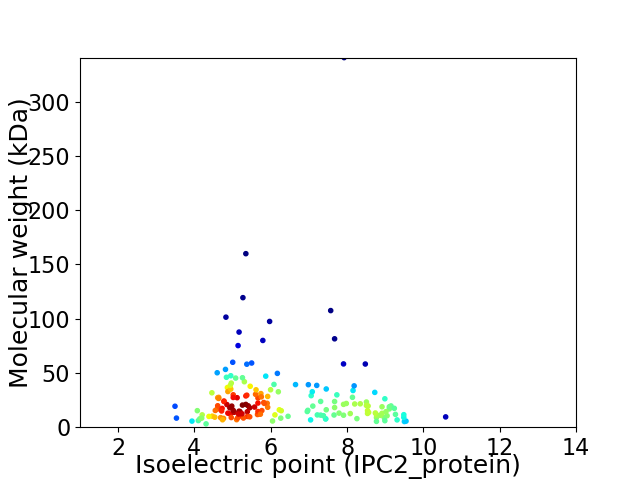
Virtual 2D-PAGE plot for 172 proteins (isoelectric point calculated using IPC2_protein)
Get csv file with sequences according to given criteria:
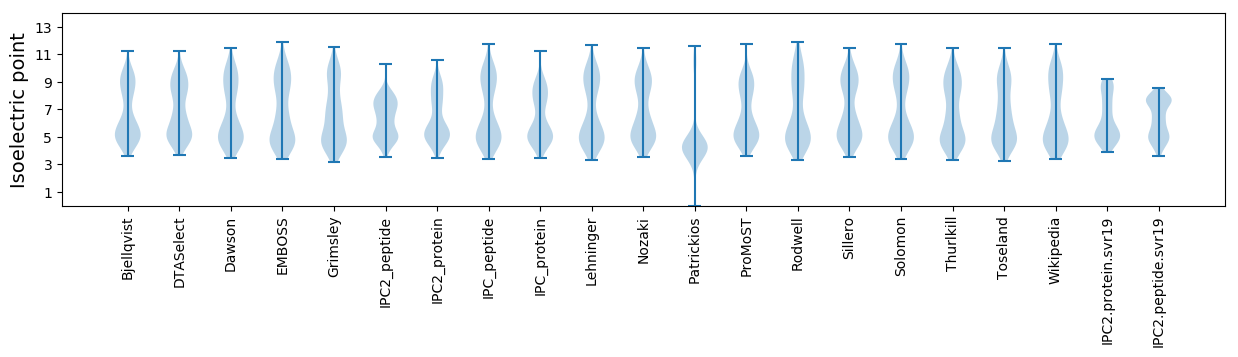
* You can choose from 21 different methods for calculating isoelectric point
Summary statistics related to proteome-wise predictions
Protein with the lowest isoelectric point:
>tr|A0A3Q9R7I5|A0A3Q9R7I5_9CAUD Uncharacterized protein OS=Bacillus phage pW2 OX=2500559 GN=pW2_76 PE=4 SV=1
MM1 pKa = 7.97DD2 pKa = 5.17KK3 pKa = 11.11EE4 pKa = 4.21NWCYY8 pKa = 11.26NCDD11 pKa = 3.36NHH13 pKa = 7.27FDD15 pKa = 4.24DD16 pKa = 5.4CEE18 pKa = 4.04CWEE21 pKa = 4.48CEE23 pKa = 3.95EE24 pKa = 5.55CGDD27 pKa = 4.19EE28 pKa = 4.42VEE30 pKa = 5.4NGEE33 pKa = 4.89KK34 pKa = 10.39YY35 pKa = 10.21CRR37 pKa = 11.84HH38 pKa = 6.53CKK40 pKa = 9.87PDD42 pKa = 3.96DD43 pKa = 4.06DD44 pKa = 4.91EE45 pKa = 4.36EE46 pKa = 4.28
MM1 pKa = 7.97DD2 pKa = 5.17KK3 pKa = 11.11EE4 pKa = 4.21NWCYY8 pKa = 11.26NCDD11 pKa = 3.36NHH13 pKa = 7.27FDD15 pKa = 4.24DD16 pKa = 5.4CEE18 pKa = 4.04CWEE21 pKa = 4.48CEE23 pKa = 3.95EE24 pKa = 5.55CGDD27 pKa = 4.19EE28 pKa = 4.42VEE30 pKa = 5.4NGEE33 pKa = 4.89KK34 pKa = 10.39YY35 pKa = 10.21CRR37 pKa = 11.84HH38 pKa = 6.53CKK40 pKa = 9.87PDD42 pKa = 3.96DD43 pKa = 4.06DD44 pKa = 4.91EE45 pKa = 4.36EE46 pKa = 4.28
Molecular weight: 5.61 kDa
Isoelectric point according different methods:
Protein with the highest isoelectric point:
>tr|A0A3T0IHG2|A0A3T0IHG2_9CAUD Putative guanylate kinase OS=Bacillus phage pW2 OX=2500559 GN=pW2_35 PE=4 SV=1
MM1 pKa = 7.6KK2 pKa = 10.56KK3 pKa = 8.9MLKK6 pKa = 10.03GLTVAILMALAIIMAIYY23 pKa = 10.47VGVFLMLGGGLMGIMSVITAGAGMTVLGWSLVKK56 pKa = 10.43ILFAGLAGYY65 pKa = 7.9ATFFVFWLPAMLLLGKK81 pKa = 9.26PKK83 pKa = 10.38KK84 pKa = 10.09RR85 pKa = 11.84FRR87 pKa = 11.84RR88 pKa = 3.74
MM1 pKa = 7.6KK2 pKa = 10.56KK3 pKa = 8.9MLKK6 pKa = 10.03GLTVAILMALAIIMAIYY23 pKa = 10.47VGVFLMLGGGLMGIMSVITAGAGMTVLGWSLVKK56 pKa = 10.43ILFAGLAGYY65 pKa = 7.9ATFFVFWLPAMLLLGKK81 pKa = 9.26PKK83 pKa = 10.38KK84 pKa = 10.09RR85 pKa = 11.84FRR87 pKa = 11.84RR88 pKa = 3.74
Molecular weight: 9.5 kDa
Isoelectric point according different methods:
Peptides (in silico digests for buttom-up proteomics)
Below you can find in silico digests of the whole proteome with Trypsin, Chymotrypsin, Trypsin+LysC, LysN, ArgC proteases suitable for different mass spec machines.| Try ESI |
 |
|---|
| ChTry ESI |
|
|---|
| ArgC ESI |
|
|---|
| LysN ESI |
|
|---|
| TryLysC ESI |
|
|---|
| Try MALDI |
|
|---|
| ChTry MALDI |
|
|---|
| ArgC MALDI |
|
|---|
| LysN MALDI |
|
|---|
| TryLysC MALDI |
|
|---|
| Try LTQ |
|
|---|
| ChTry LTQ |
|
|---|
| ArgC LTQ |
|
|---|
| LysN LTQ |
|
|---|
| TryLysC LTQ |
|
|---|
| Try MSlow |
|
|---|
| ChTry MSlow |
|
|---|
| ArgC MSlow |
|
|---|
| LysN MSlow |
|
|---|
| TryLysC MSlow |
|
|---|
| Try MShigh |
|
|---|
| ChTry MShigh |
|
|---|
| ArgC MShigh |
|
|---|
| LysN MShigh |
|
|---|
| TryLysC MShigh |
|
|---|
General Statistics
Number of major isoforms |
Number of additional isoforms |
Number of all proteins |
Number of amino acids |
Min. Seq. Length |
Max. Seq. Length |
Avg. Seq. Length |
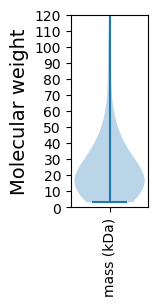
Avg. Mol. Weight |
|---|---|---|---|---|---|---|---|
0 |
40810 |
29 |
3126 |
237.3 |
27.16 |
Amino acid frequency
Ala |
Cys |
Asp |
Glu |
Phe |
Gly |
His |
Ile |
Lys |
Leu |
|---|---|---|---|---|---|---|---|---|---|
5.577 ± 0.386 | 0.828 ± 0.094 |
6.513 ± 0.152 | 8.27 ± 0.317 |
4.217 ± 0.157 | 6.275 ± 0.249 |
1.894 ± 0.144 | 6.876 ± 0.185 |
9.12 ± 0.2 | 7.866 ± 0.18 |
Met |
Asn |
Gln |
Pro |
Arg |
Ser |
Thr |
Val |
Trp |
Tyr |
|---|---|---|---|---|---|---|---|---|---|
3.021 ± 0.138 | 5.883 ± 0.151 |
2.262 ± 0.108 | 3.551 ± 0.246 |
4.097 ± 0.161 | 5.484 ± 0.213 |
6.087 ± 0.311 | 6.618 ± 0.174 |
1.137 ± 0.077 | 4.423 ± 0.232 |
Most of the basic statistics you can see at this page can be downloaded from this CSV file
See this proteome in:

Proteome-pI is available under Creative Commons Attribution-NoDerivs license, for more details see here
| Reference: Kozlowski LP. Proteome-pI 2.0: Proteome Isoelectric Point Database Update. Nucleic Acids Res. 2021, doi: 10.1093/nar/gkab944 | Contact: Lukasz P. Kozlowski |