Marine gokushovirus
Taxonomy: Viruses; Monodnaviria; Sangervirae; Phixviricota; Malgrandaviricetes; Petitvirales; Microviridae; Gokushovirinae; unclassified Gokushovirinae
Average proteome isoelectric point is 6.59
Get precalculated fractions of proteins
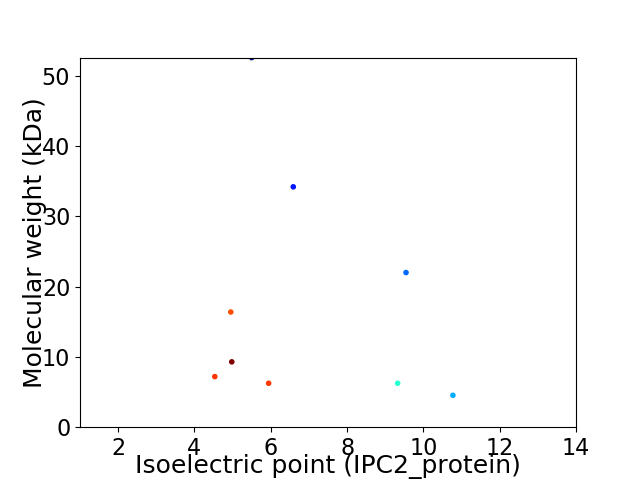
Virtual 2D-PAGE plot for 9 proteins (isoelectric point calculated using IPC2_protein)
Get csv file with sequences according to given criteria:
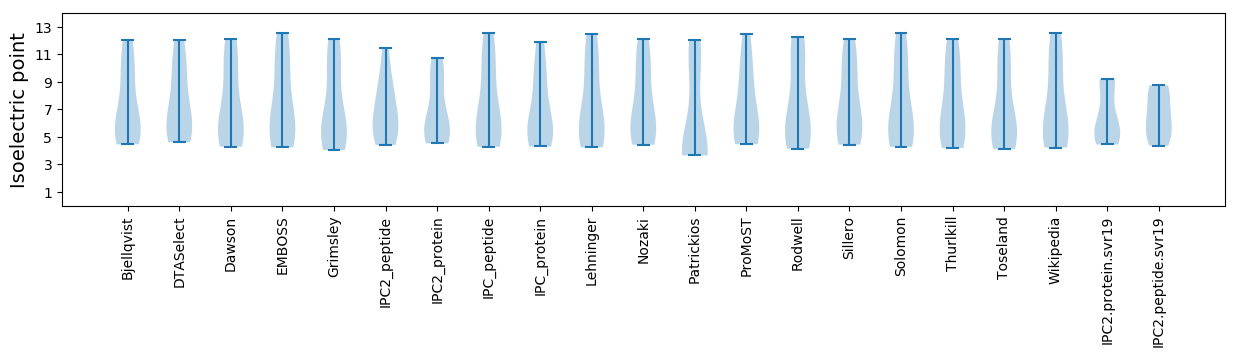
* You can choose from 21 different methods for calculating isoelectric point
Summary statistics related to proteome-wise predictions
Protein with the lowest isoelectric point:
>tr|U5KPB8|U5KPB8_9VIRU Portal protein OS=Marine gokushovirus OX=1385658 PE=4 SV=1
MM1 pKa = 7.49AFVPRR6 pKa = 11.84LQQLPVLNASFIEE19 pKa = 4.29EE20 pKa = 4.42NPPIDD25 pKa = 3.7RR26 pKa = 11.84VVALPTEE33 pKa = 4.36PDD35 pKa = 4.6LLFDD39 pKa = 4.17WYY41 pKa = 11.27FDD43 pKa = 3.88MKK45 pKa = 9.6CTRR48 pKa = 11.84PMPTYY53 pKa = 10.29SVPGLIDD60 pKa = 3.2HH61 pKa = 7.26FF62 pKa = 4.9
MM1 pKa = 7.49AFVPRR6 pKa = 11.84LQQLPVLNASFIEE19 pKa = 4.29EE20 pKa = 4.42NPPIDD25 pKa = 3.7RR26 pKa = 11.84VVALPTEE33 pKa = 4.36PDD35 pKa = 4.6LLFDD39 pKa = 4.17WYY41 pKa = 11.27FDD43 pKa = 3.88MKK45 pKa = 9.6CTRR48 pKa = 11.84PMPTYY53 pKa = 10.29SVPGLIDD60 pKa = 3.2HH61 pKa = 7.26FF62 pKa = 4.9
Molecular weight: 7.19 kDa
Isoelectric point according different methods:
Protein with the highest isoelectric point:
>tr|U5KQ03|U5KQ03_9VIRU Packaging protein OS=Marine gokushovirus OX=1385658 PE=4 SV=1
MM1 pKa = 6.87MKK3 pKa = 10.02YY4 pKa = 9.59RR5 pKa = 11.84KK6 pKa = 9.73KK7 pKa = 10.22MSAKK11 pKa = 9.92SSRR14 pKa = 11.84KK15 pKa = 9.24QFTKK19 pKa = 10.77GAMKK23 pKa = 10.7VKK25 pKa = 10.15GKK27 pKa = 10.19NFTKK31 pKa = 10.34PMRR34 pKa = 11.84GGIRR38 pKa = 11.84LL39 pKa = 3.45
MM1 pKa = 6.87MKK3 pKa = 10.02YY4 pKa = 9.59RR5 pKa = 11.84KK6 pKa = 9.73KK7 pKa = 10.22MSAKK11 pKa = 9.92SSRR14 pKa = 11.84KK15 pKa = 9.24QFTKK19 pKa = 10.77GAMKK23 pKa = 10.7VKK25 pKa = 10.15GKK27 pKa = 10.19NFTKK31 pKa = 10.34PMRR34 pKa = 11.84GGIRR38 pKa = 11.84LL39 pKa = 3.45
Molecular weight: 4.54 kDa
Isoelectric point according different methods:
Peptides (in silico digests for buttom-up proteomics)
Below you can find in silico digests of the whole proteome with Trypsin, Chymotrypsin, Trypsin+LysC, LysN, ArgC proteases suitable for different mass spec machines.| Try ESI |
 |
|---|
| ChTry ESI |
|
|---|
| ArgC ESI |
|
|---|
| LysN ESI |
|
|---|
| TryLysC ESI |
|
|---|
| Try MALDI |
|
|---|
| ChTry MALDI |
|
|---|
| ArgC MALDI |
|
|---|
| LysN MALDI |
|
|---|
| TryLysC MALDI |
|
|---|
| Try LTQ |
|
|---|
| ChTry LTQ |
|
|---|
| ArgC LTQ |
|
|---|
| LysN LTQ |
|
|---|
| TryLysC LTQ |
|
|---|
| Try MSlow |
|
|---|
| ChTry MSlow |
|
|---|
| ArgC MSlow |
|
|---|
| LysN MSlow |
|
|---|
| TryLysC MSlow |
|
|---|
| Try MShigh |
|
|---|
| ChTry MShigh |
|
|---|
| ArgC MShigh |
|
|---|
| LysN MShigh |
|
|---|
| TryLysC MShigh |
|
|---|
General Statistics
Number of major isoforms |
Number of additional isoforms |
Number of all proteins |
Number of amino acids |
Min. Seq. Length |
Max. Seq. Length |
Avg. Seq. Length |
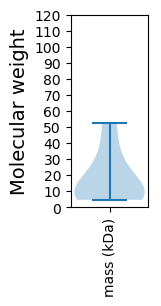
Avg. Mol. Weight |
|---|---|---|---|---|---|---|---|
0 |
1420 |
39 |
473 |
157.8 |
17.62 |
Amino acid frequency
Ala |
Cys |
Asp |
Glu |
Phe |
Gly |
His |
Ile |
Lys |
Leu |
|---|---|---|---|---|---|---|---|---|---|
9.085 ± 1.438 | 1.549 ± 0.605 |
5.423 ± 0.814 | 5.423 ± 1.262 |
4.718 ± 0.412 | 8.31 ± 1.071 |
2.465 ± 0.606 | 4.718 ± 0.432 |
6.831 ± 1.418 | 7.042 ± 0.505 |
Met |
Asn |
Gln |
Pro |
Arg |
Ser |
Thr |
Val |
Trp |
Tyr |
|---|---|---|---|---|---|---|---|---|---|
2.958 ± 0.485 | 4.366 ± 0.467 |
5.141 ± 0.563 | 4.648 ± 0.621 |
4.93 ± 0.538 | 5.493 ± 0.826 |
4.718 ± 0.393 | 6.408 ± 0.744 |
1.338 ± 0.285 | 4.437 ± 0.669 |
Most of the basic statistics you can see at this page can be downloaded from this CSV file
See this proteome in:

Proteome-pI is available under Creative Commons Attribution-NoDerivs license, for more details see here
| Reference: Kozlowski LP. Proteome-pI 2.0: Proteome Isoelectric Point Database Update. Nucleic Acids Res. 2021, doi: 10.1093/nar/gkab944 | Contact: Lukasz P. Kozlowski |